Figures & data
Figure 1. Schematic representation of the default AMF in Nucleus devices. The Q-parameter setting defines the percentage of the electrical DR to which the top 10 dB of the IIDR is mapped. The minimum, maximum and default settings in the fitting software equal 10, 50, and 20, respectively. The upward and downward pointing arrows indicate maximum adjustments of the Q-parameter setting in the fitting software. These adjustments result in the AMFs shown with dotted lines in gray.
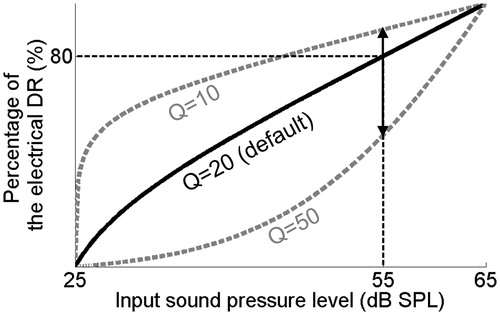
Table 1. Characteristics of the 17 CI users that participated in the study.
Figure 2. Subject-specific average JNDs as measured at a fixed speech level of 60 dB SPL in noise at a signal-to-noise level of +5 dB (y-axis) and in quiet (x-axis). JNDs are represented in terms of differences in the Q-parameter setting. The error bars represent the standard deviation of repeated measurements. Dotted line: x = y.
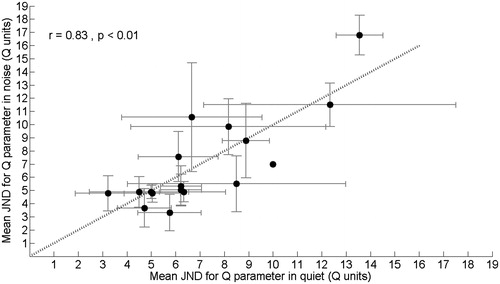
Table 2. Summary of the data collected after the trial period as used for analysis.
Figure 3. The mean VAS ratings for individual subjects when listening to speech in quiet (upper panel), speech in noise (middle panel) and tango music (lower panel) with different Q-parameter settings. The error bars represent the mean of the standard deviations for the repeated measurements per subject, listening situation and Q-parameter setting.
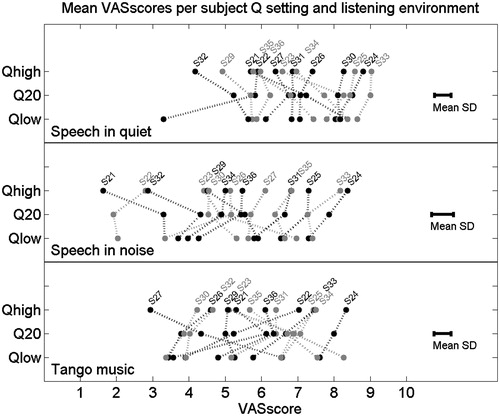
Figure 4. Box-and-whisker plots for the subject-specific mean phoneme scores at 50 dB in quiet, measured with different Q-parameter settings for the 15 subjects. The gray lines represent the results for individual subjects. The asterisks indicate significant differences (see text for details).
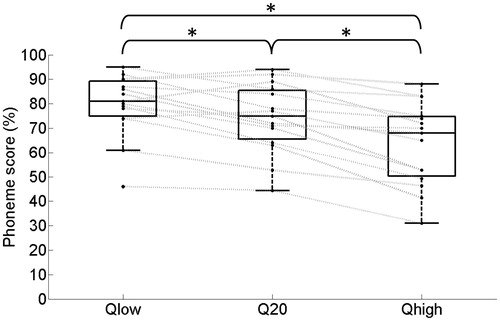
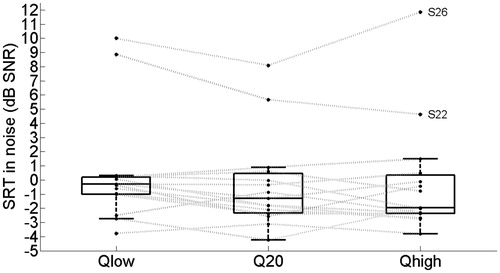
Figure 5. Box-and-whisker plots for the subject-specific mean SRT values in noise, measured with different Q-parameter settings for the 15 subjects. The gray lines represent the results for individual subjects (see text for details).