Figures & data
Figure 1. Photograph of Kanso (CP950, left) and Nucleus 6 (CP920, right) sound processors showing form differences and relative size.
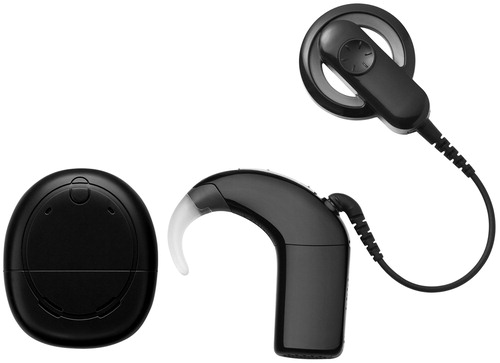
Table 1. Biographical data of study participants.
Figure 2. Polar patterns for Kanso and Nucleus 6 sound processors while worn by a head-and-torso simulator (KEMAR). Zero degrees (upward) are taken as the direction the listener is facing. Processors were placed on the right ear. Top: For the dual-microphone Standard directional microphone programme. Bottom: For the dual-microphone zoom highly directional microphone programme.
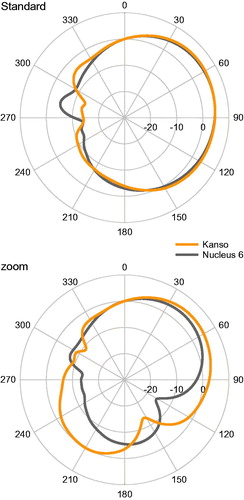
Figure 3. (A) Group mean per cent word understanding in quiet. (B) Group mean speech understanding for speech in co-located four-talker babble. Error bars show the standard error of the mean.
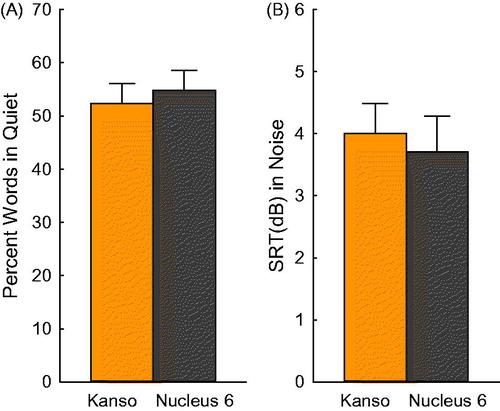
Figure 4. Group mean speech understanding of the Kanso and Nucleus 6 sound processors for speech in spatially separated four-talker babble noise. Both processors were tested in four SmartSound iQ programmes. Error bars show the standard error of the mean.
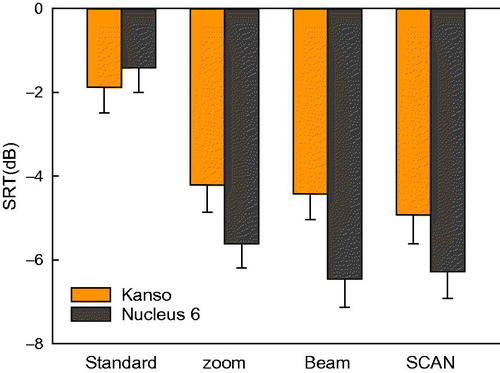
Figure 5. Group mean speech understanding for the Kanso sound processor for speech in four-talker babble in spatially separated noise. Four SmartSound iQ programmes were used, as well as one research programme which used a single microphone only. Error bars show the standard error of the mean. Asterisks show significance with *** = p < 0.001.
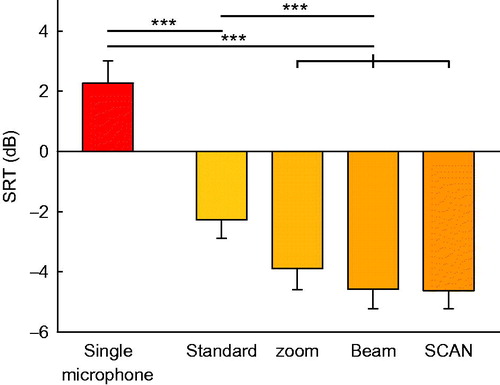
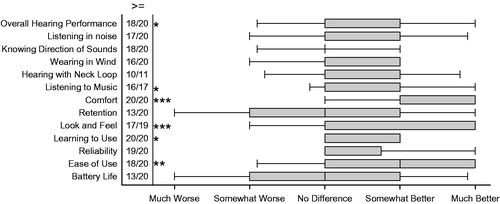
Figure 6. Survey results showing user ratings of Kanso relative to the users’ own sound processor. The column on the left (> =) shows the proportion of responses rating Kanso equal or, better than the users’ own sound processor, as well as the total number of responses for each question. Asterisks show significance compared to “No Difference”; * = p < 0.05, ** = p < 0.01, *** = p < 0.001. Box plots show 25th, 50th and 75th percentiles. Error bars show the 5th and 95th percentiles.