
Figures & data
Figure 1. The hearing thresholds of the individual subjects for the ear with the HA. The solid line displays the mean hearing loss.
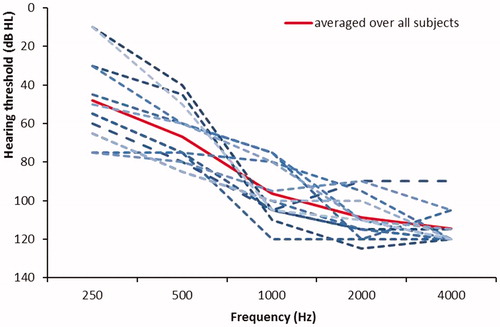
Table 1. Participant demographics, including details of hearing losses and HA and CI experience.
Figure 2. A schematic representation of the test environment. The CI user is in the middle of five loudspeakers, all at a distance of 1 m. The MM is placed at 0.3 m from the loudspeaker with the speech material, the other four loudspeakers presented uncorrelated speech-shaped noises.
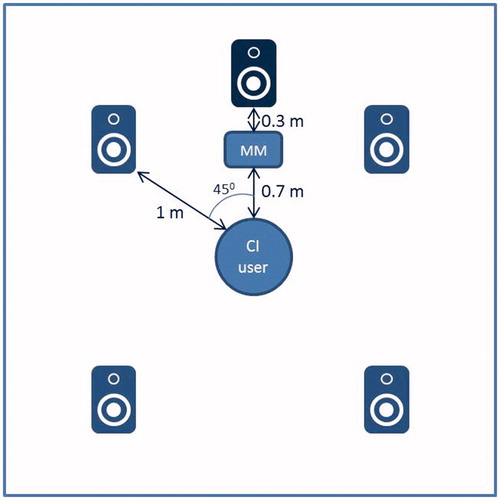
Figure 3. The results of the speech perception in noise test for the four listening conditions. p values are uncorrected p values of Wilcoxon-signed rank tests. Asterisks denote significant differences after correction for multiple comparisons. The error bars represent the standard errors of the mean.
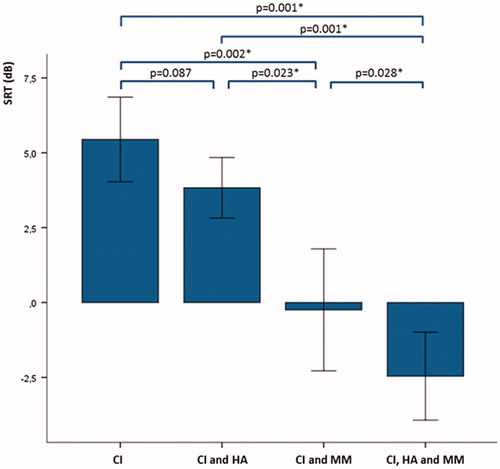
Figure 4. The results for the diary for the six different listening situations. Asterisks denote significant differences. The error bars represent the standard errors of the mean.
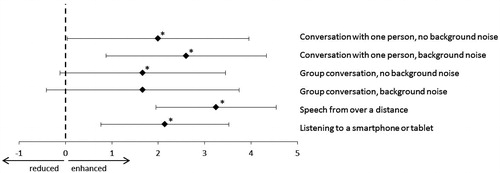
Table 2. Different places were the MM is used during the evaluation at home for the different listening situations.