
Figures & data
Table 1. Baseline characteristics of included patients arranged by age-at-implantation group.
Table 2. Mann–Whitney U-tests between age-at-implantation groups on raw CVC(A) scores.
Table 3. Report of Spearman's rho correlation among variables.
Figure 1. Proportion of children from each age-at-implantation group reaching the CVC(A) ceiling score at five-year follow-up. Error bars represent the 95% confidence interval. Between-groups analysis using Fisher exact test confirmed performance differences between group 1 and 4 (p < 0.001), group 1 and 5 (p < 0.001) and group 2 and 4 (p < 0.001) following Bonferroni correction.
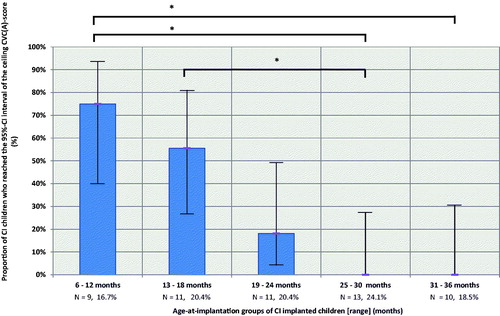
Table 4. Report of results of binominal logistic regression analysis.