Figures & data
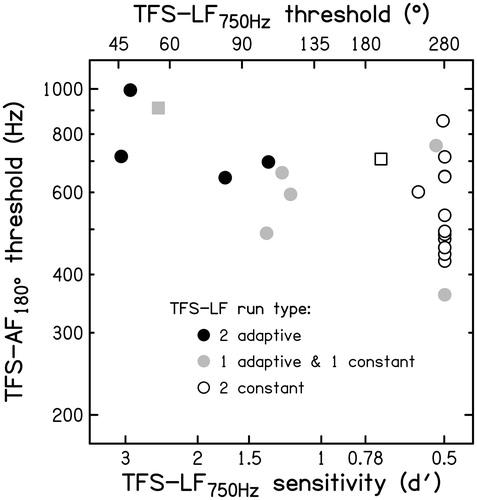
Figure 1. Individual (thin lines) and mean (thick grey line) thresholds for the TFS-AF test, using a fixed interaural phase difference (φ) of 180°. The frequency at threshold is plotted for nine YNH listeners for 21 consecutive threshold runs (top panel) distributed over three test sessions. Threshold runs were conducted in blocks of three, separated by breaks. Individual (thin lines) and mean (thick grey line) thresholds for each of the seven test blocks are shown in the bottom panel.
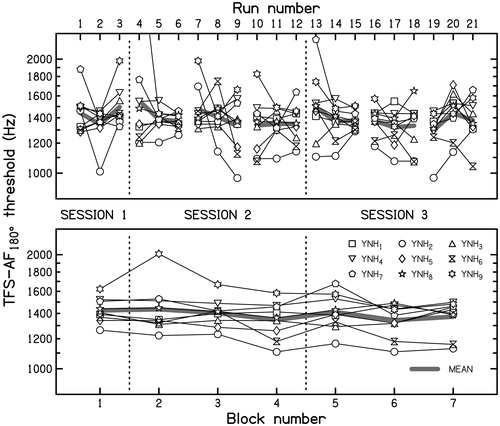
Figure 2. Mean individual thresholds (thin lines) and overall mean thresholds for YNH listeners (thick grey line) for the TFS-AF test as a function of the value of φ. The diagonal dashed lines show equal-ITD contours, with the value of the ITD in μs indicated at the top.
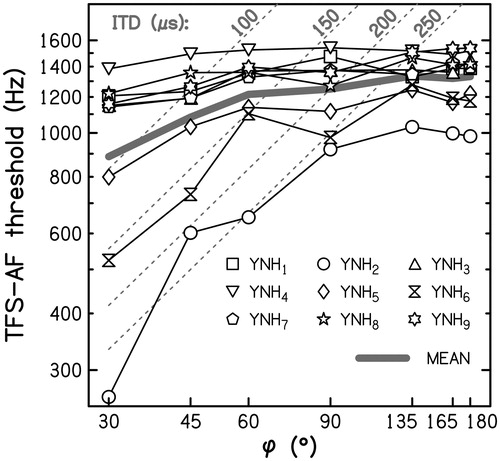
Figure 3. Mean individual thresholds (thin lines) and overall mean thresholds for YNH listeners (thick grey line) for the TFS-LF test as a function of the frequency of the pure tones. To facilitate comparison with previous studies, TFS thresholds are expressed in terms of the sensitivity index d′ on the right axis.
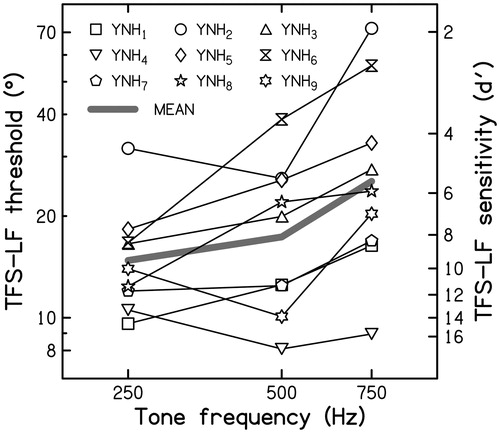
Figure 4. Mean individual thresholds (thin lines) and overall mean thresholds for YNH listeners (thick black and grey line) for the TFS-AF test as a function of the IPD expressed relative to individual and mean TFS-LF thresholds for 250-Hz tones, respectively (logarithmic scale). Filled symbols indicate TFS-AF thresholds that were more than 15% below that for φ = 180°. The dashed line indicates that the “critical ratio” below which thresholds started to worsen is close to three.
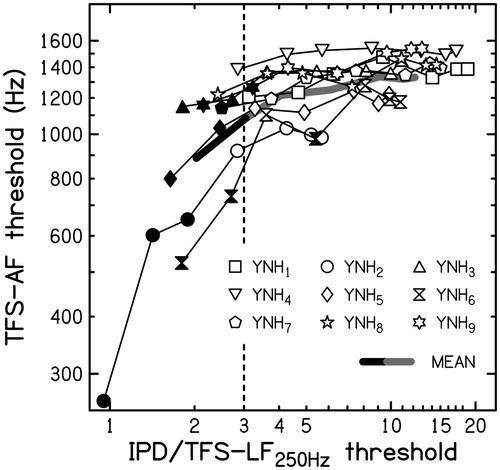
Table 1. Pearson product-moment correlation coefficients across the YNH listeners and associated uncorrected significance levels (one-tailed) between the mean thresholds for each of the seven values of φ for the TFS-AF test (rows) and the mean thresholds for each of the three frequencies used for the TFS-LF test (columns).
Figure 5. Results for ONH listeners, comparing TFS-AF thresholds (ordinate) with scores from the TFS-LF test, shown as IPD thresholds on the top axis and d′ values estimated to occur for an φ = 180° on the bottom axis. Squares and circles show results for middle-aged and older listeners, respectively. Results for listeners who completed the TFS-LF adaptive procedure twice are shown by filled circles. Grey and open symbols show results when the adaptive procedure was not completed and a constant-stimulus procedure was used once or twice, respectively. When a constant-stimulus procedure was used and the scores were not significantly different from chance based on a binomial distribution, the symbols are plotted arbitrarily at d′ = 0.5 or φ = 280°.