Figures & data
Figure 1. Mean acceptable noise level (ANL) values for the four combinations defined by combined settings of noise reduction algorithm (NRA) off/on and with/without additional 5% increase of M-levels (ΔM). Error bars represent 95% confidence intervals.
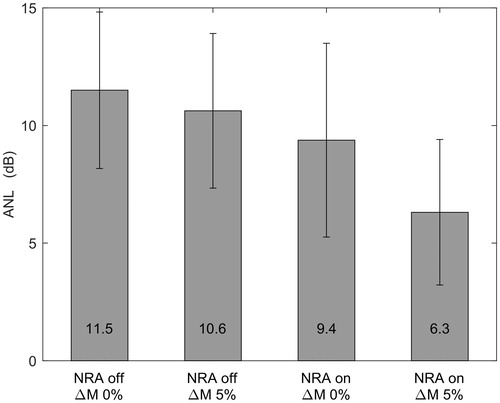
Figure 2. Mean most comfortable level (MCL) values for the four combinations defined by combined settings of noise reduction algorithm (NRA) off/on and with/without additional 5% increase of M-levels (ΔM). Error bars represent 95% confidence intervals.
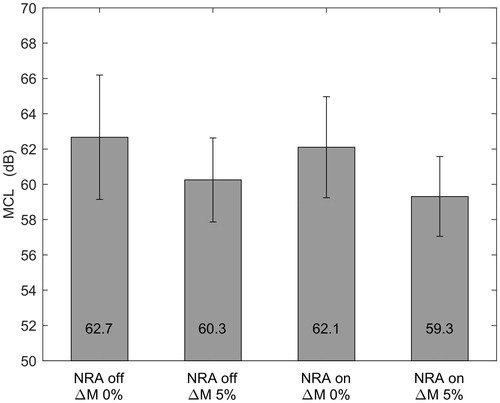
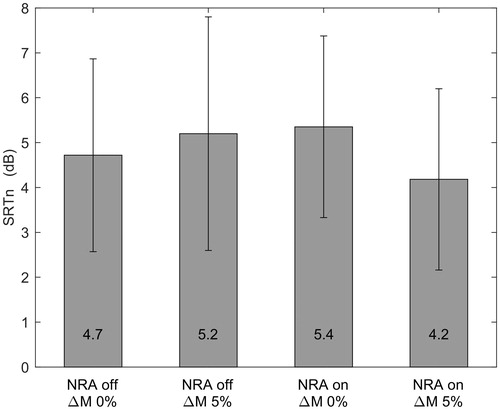
Figure 3. Mean speech reception thresholds in noise (SRTn) values for the four combinations defined by combined settings of noise reduction algorithm (NRA) off/on and with/without additional 5% increase of M-levels (ΔM). Error bars represent 95% confidence intervals.