
Figures & data
Figure 1. Hearing sensitivity in females being treated with the aminoglycoside, amikacin, most commonly for mycobacterium infection or cystic fibrosis. Circles represent ear-specific thresholds at 4 kHz. Lines represent sex and age-matched normative data (ISO, Citation2000); light grey is the 95th percentile, dashed dark grey is the 50th percentile, and black is the 5th percentile. Left panel (A) thresholds obtained at the end of audiometric monitoring reveal that 10% of ears fall outside the normative range of hearing. However, when change in hearing over time is considered, right panel (B), over twice as many ears showed change (>10 dB) in hearing. Over half of these cases would not have been identified as having ototoxic change if normative ranges alone were used.
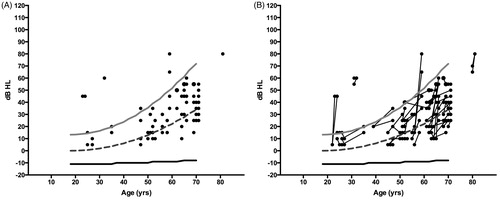
Figure 2. Two case examples of decline in hearing sensitivity from ototoxicity. Panel A shows decline in hearing one year after cisplatin chemotherapy, and panel B shows decline one year after exposure to the aminoglycoside, amikacin. Baseline pre-exposure hearing levels are represented by grey circles and black circles represent thresholds following therapy. The amount of change and range of frequencies affected is notably different between the two cases, and yet ASHA criteria for ototoxicity treats both cases the same; affirming, yes, ototoxicity occurred but making no other distinction. In both cases the change in hearing was sensorineural (bone conduction data not plotted) and bilateral, however, only a single ear from each patient is shown.
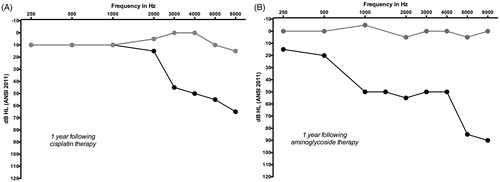
Figure 3. Two audiograms documenting ototoxic change in the same individual. Panel A shows an early and clinically significant change from an ototoxic agent; Panel B shows later change in hearing in the same person after continued exposure. Both audiograms meet criteria for a CTCAE version 4.03 grade 3, despite the fact that one (B) represents significantly more change in hearing and a predicted increase in functional severity with the inclusion of 2 kHz compared to the other (A). Baseline pre-exposure hearing levels are represented by grey circles and black circles represent thresholds during the course of therapy. In both examples, the change in hearing was sensorineural (bone conduction data not plotted) and bilateral, although only a single ear is shown.
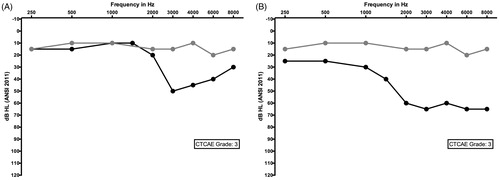
Table 1. Ototoxicity classifications and grading scales.
Figure 5. Baseline (grey circles) and follow up (black circles) audiogram from an adolescent female undergoing high dose therapy with the loop diuretic, furosemide (Lasix). Ototoxic grading scales that emphasise high-frequency change in hearing (e.g. CTCAE version 4.03 paediatric version) would not be sensitive to capturing this significant decline that occurred early in the course of treatment. The change in hearing was sensorineural (bone conduction data not shown) and bilateral, although data from only a single ear is shown.
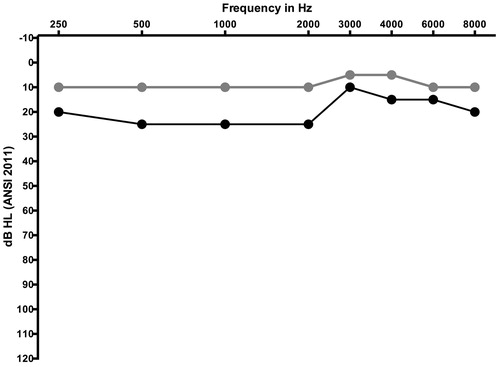
Figure 4. Baseline audiogram representing air conduction hearing thresholds from one ear of an adolescent female prior to exposure to a potential ototoxic medication. Both the SIOP and Brock scales do not account for pre-existing hearing loss; this audiogram would be graded a 3 on both scales prior to any ototoxic exposure.
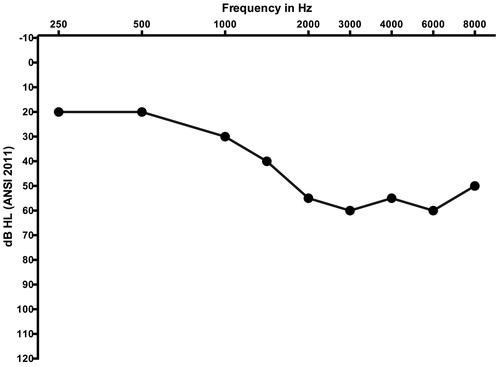
Table 2. Proposed ABR-derived adverse event schema. This application requires data collected using air-conducted tone burst stimuli from 0.5 to 4 kHz and assumes normal middle ear function.