Figures & data
Table 1. Stimuli and mean values of the characteristics of the transients used.
Figure 1. Mean and 95% confidence intervals of per cent correct scores for the speech intelligibility in noise test for six conditions. The two light grey bars on the left show speech scores for speech without transients. The four dark grey bars show speech scores values for speech with transients. The annotations C1–C6 give the condition numbering. Several test conditions were compared and uncorrected p-values were shown. Asterisks denote that a difference is significant after correction for multiple comparisons. Dashed lines show the significance of differences due to TNR, solid lines show the significance of CNR effects, and dash-dotted lines show the significance of the effect of transients.
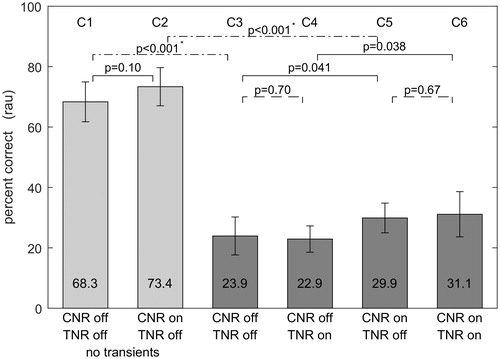
Figure 2. Mean and 95% confidence intervals of ANL values. The two light grey bars on the left show ANL values for speech without transients. The four dark grey bars show ANL values for speech with transients. The annotations C1–C6 give the condition numbering. Several test conditions were compared and uncorrected p-values were shown. Asterisks denote that a difference is significant after correction for multiple comparisons. Dashed lines show the significance of differences due to TNR, solid lines show the significance of CNR effects, and dash-dotted lines show the significance of the effect of transients.
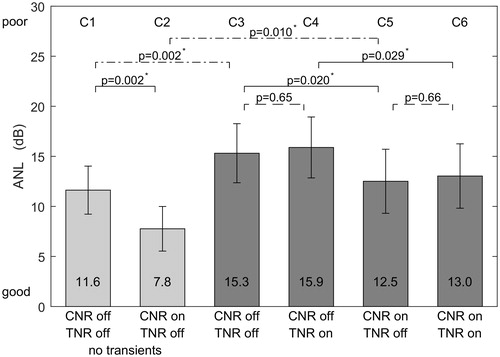
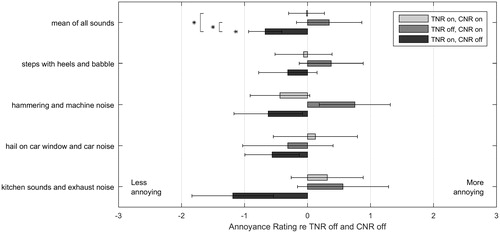
Figure 3. Mean and 95% confidence intervals of the relative annoyance rating scores, derived from the paired-comparison data, for four different sounds. Each bar indicates the relative annoyance for a sound and test condition compared with the reference condition with TNR-off and CNR-off. For the mean of all sounds, asterisks indicate differences that were significant on the p < 0.05 level.