
Figures & data
Figure 1. Mean and individual ABR Wave V amplitude (A) and latency (B) values obtained for tone bursts of 500 Hz, 2000 Hz, 4000 Hz, click and broad-band chirp stimuli by the B71 (triangles) and the B81 (circles). The data of the BC transducers are shown side by side for each stimuli level and the scatter plot shows individual values. Error bars represent 95% confidence intervals for the mean values. For the latency data (B), Wave V latency in response to broad-band chirp stimuli were adjusted by the Eclipse system to allow direct comparison with clicks (TB: tone burst).
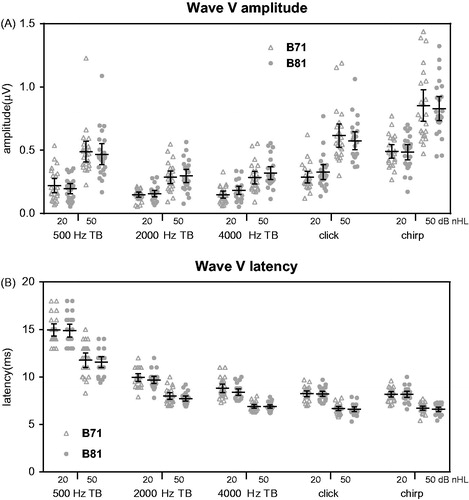
Figure 2. Boxplot of the observed differences in ABR wave V amplitudes calculated as percentage difference (see Methods section) for the B81 across the stimuli used. The lines mark the medians, the boxes extend from the 25th to 75th percentiles, and the whiskers extend from 10th to 90th percentiles. Symbols mark the outliers. (TB: tone burst).
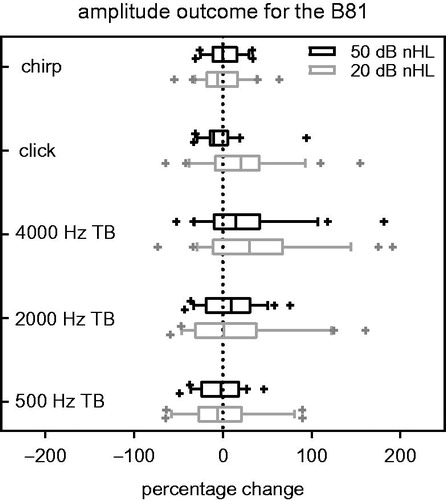
Table 1. Summary of the comparison of the ABR wave V amplitudes obtained by the B71 and the B81 for each sound stimulus and intensity level.
Figure 3. The amplitude of the electrical stimulus artefact imposed on the ABR recordings for the B71 (triangles) and the B81 (circles). Mean of the peak values of Hilbert envelopes of single polarity sweeps are given side by side for the two BC transducers. Scatterplot shows the individual values. Only the sweeps recorded in response to 50 dB nHL stimulus level were analysed. Error bars represent 95% confidence intervals of the mean values. Arrow indicates an outlier with a value of 43.75 µV. Inset shows a sample trace recorded using the B71 and 4000 Hz tone burst stimulus. Hilbert envelope of the electrical artefact caused by the BC transducer is marked by the letter H. Asterix marks the wave V ABR response.
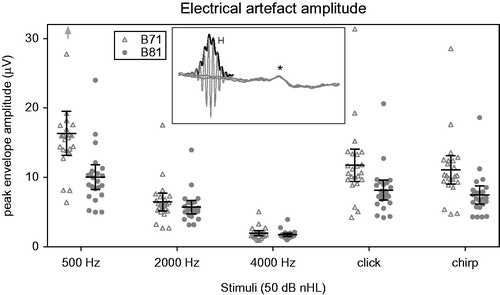
Table 2. Summary of stimulus parameters utilised in previous bone conduction ABR studies on normal hearing adults using the B71.
Table 3. Summary of ABR Wave V latency values in normal hearing adults reported in previous studies using the B71.