Figures & data
Figure 1. Geographical locations across the UK of survey respondents (N = 134).
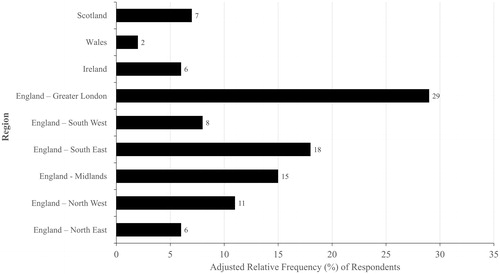
Figure 2. ARF (%) distribution of responses to questions asking if ototoxicity monitoring of hearing and balance function and if baseline assessments were performed.
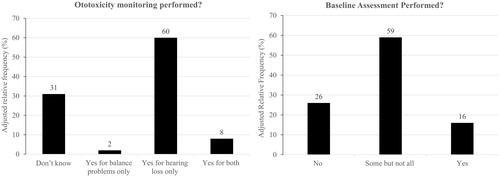
Table 1. ARF (%) showing which patient groups are mostly exposed to ototoxic agents (respondents were allowed to choose multiple options).
Table 2. Absolute frequencies (%) from each target group regarding the patient referral pathway.
Figure 4. (a–f) Relative frequency (RF) of respondents by choice (%) specifying the different ototoxicity management services that they offer (respondents were asked to choose all the options that applied to their service. n: number of respondents to each question).
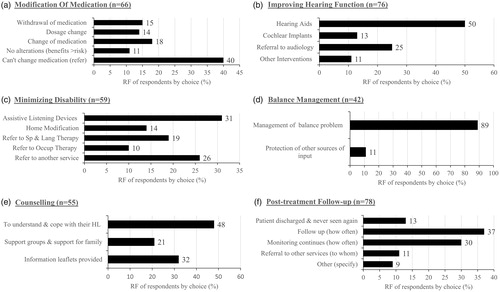
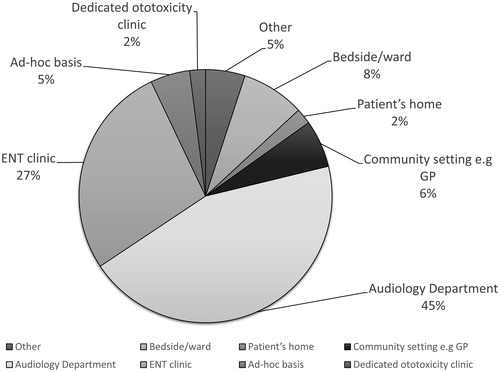
Figure 3. Pie chart illustrating the distribution of the various locations where patients with ototoxicity are generally management.