
Figures & data
Table 1. Demographics and characteristics of the participating subjects with conductive (CHL) or mixed hearing loss. Five subjects had a unilateral CHL (uCHL) or mixed hearing loss and six subjects had a bilateral CHL (bCHL) or mixed hearing loss. Congenital and acquired hearing losses occurred in both groups. PTA4 is the average of thresholds at 0.5, 1, 2 and 4 kHz. Aided PTA4 is the average of the frequency-modulated thresholds at 0.5, 1, 2 and 4 kHz recorded in sound-field with the non-implant ear plugged and with the Bone Conduction Implant active (Eeg-Olofsson et al. Citation2014; Reinfeldt et al. Citation2015).
Figure 1. Unaided versus aided individual sound localisation accuracy (SLA) at 63 dB SPL (left panel) and 73 dB SPL (right panel), quantified as an error index (EI). Open squares denote subjects with bilateral conductive hearing loss (bCHL) and open circles denote subjects with unilateral conductive hearing loss (uCHL). Markers above the solid diagonal line represent subjects with higher SLA in the aided versus the unaided condition, i.e. an aided benefit. All markers outside the grey area surrounding the diagonal indicates statistically significant within-subject differences >0.054 (aided versus unaided; p < .05), based on a test-retest reliability analysis in previous work (Asp, Olofsson, and Berninger Citation2016). The lower limits of the 95% confidence intervals for random SLA are drawn as dashed straight lines at EI = 0.72, dividing the figure into four quadrants. Each quadrant provides boundaries for the interpretation of SLA in each subject. Thus, subjects in the lower left quadrant reveal SLA better than random performance in both the aided and the unaided condition, subjects in the upper left quadrant can only localise in the aided condition, subjects in the lower right quadrant can only localise in the unaided condition, while subjects in the upper right quadrant cannot localise neither in the aided nor in the unaided condition. The mean EI from normal-hearing (NH) subjects (n = 8, mean EI = 0.054) at 63 dB SPL is provided in the left panel (solid diamond) to facilitate interpretation of data from subjects with CHL (Asp, Olofsson, and Berninger Citation2016). The x-coordinate for the solid diamond reflects the mean EI in normal binaural conditions for NH subjects. The y-coordinate for the solid diamond reflects the mean EI for NH subjects in a simulated unilateral hearing loss condition, and the solid line denote the standard deviation (Asp, Jakobsson, and Berninger Citation2018).
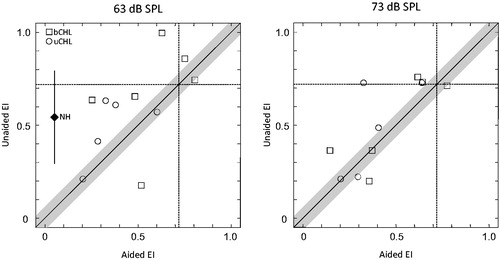
Figure 2. Aided and unaided individual horizontal sound localisation accuracy (SLA) at 63 dB SPL. Open circles (the two left-most columns: unilateral conductive hearing loss; uCHL) and squares (the two right-most columns: bilateral conductive hearing loss; bCHL) represent perceived sound-source azimuth versus presented sound-source azimuth. Markers along the diagonal in each panel denote high SLA, while markers far away from the diagonal denote poor SLA. Each pair of panels (aided and unaided) is labelled with a study-id to facilitate comparison with . Asterisks (*) denote significant differences (p < .05) between aided and unaided conditions, and is placed in the panel with the highest SLA (e.g. subject 6 showed significant aided benefit, while subject 204 revealed significantly higher SLA in the unaided condition).
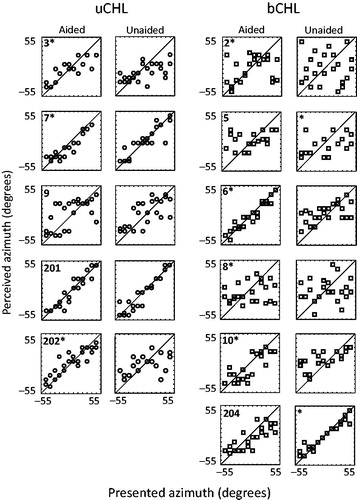
Figure 3. Linear regression analyses of the aided Error Index as a function of pure-tone average (0.5, 1, 2 and 4 kHz; PTA4 [dB HL]) in the non-implant ear.
![Figure 3. Linear regression analyses of the aided Error Index as a function of pure-tone average (0.5, 1, 2 and 4 kHz; PTA4 [dB HL]) in the non-implant ear.](/cms/asset/674b29ec-49b4-4074-a86d-fe643c84265d/iija_a_1470337_f0003_b.jpg)