Figures & data
Figure 1. Mean and standard deviation for pure tone hearing thresholds in right ear for all subjects at all frequencies. N = 43.
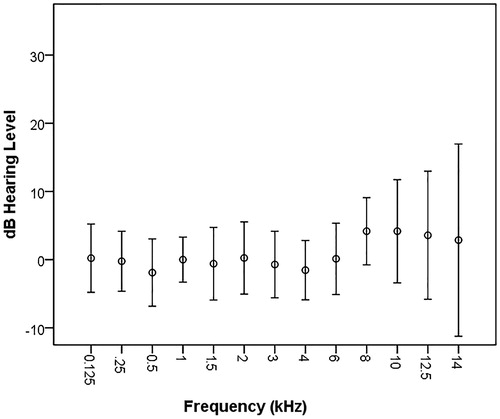
Figure 2. Mean and standard deviation for pure tone hearing thresholds in left ear for all subjects at all frequencies. N = 43.
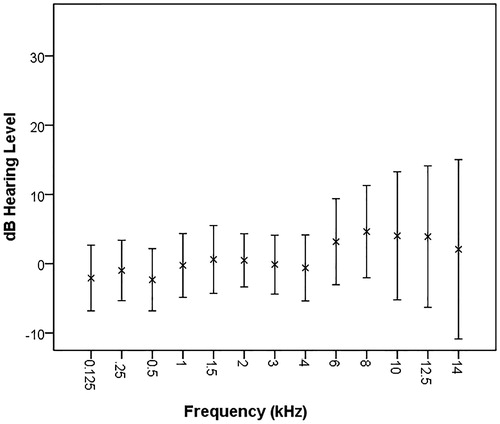
Table 1. Raw mean WMC (average accuracy scores for the three N-back conditions divided by response times for the same conditions), inhibitory control (the proportion correctly withheld responses divided by the average response times for non-target trials), shifting ability (the combined scores for shift-trials subtracted from the combined scores for no-shift trials, see text for more details), and information updating (proportion correctly recalled content words) performance along with standard deviations and minima and maxima.
Table 2. Performance for all subjects pooled together. Otherwise as in .
Table 3. Pearson's correlation coefficients (r) between BEHFPTA, WEHFPTA, and HFPTAasymmetry and WMC, inhibitory control, cognitive flexibility, and global executive function. Benjamini and Hochberg’s (Citation1995) false discovery rate was used to calculate a corrected alpha level to adjust for the multiple correlations calculated (N = 43).
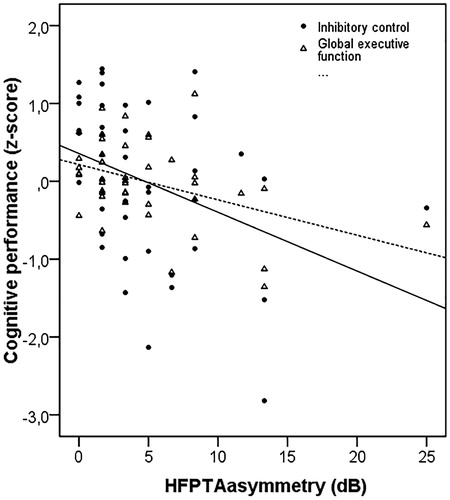
Figure 3. Scatter plot showing the relationship between HFPTAasymmetry (dB) and inhibitory control (filled circles) and global executive function (open triangles) and shifting ability for individual subjects. The lines represent the linear interpolation for inhibitory control (drawn line) and global executive function (dashed line). A higher score indicates better performance. N = 43.