
Figures & data
Figure 1. Selection of studies for the systematic review based on Preferred Reporting Items for Systematic Reviews and Meta-Analyses (PRISMA) flow diagram.
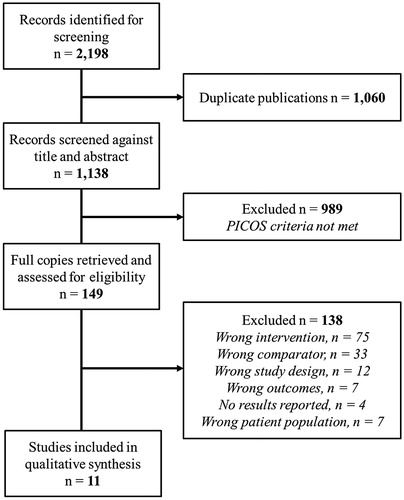
Figure 2. Summary of the random effects meta-analyses for speech intelligibility: (A) PSAPs vs. unaided; (B) Hearing aids + FM system vs. Unaided; (C) Hearing aids + FM system vs. Hearing aids alone; (D) Hearing aids + FM system vs. FM only; (E) Hearing aids + FM system vs. Hearing aids +2.4 GHz system; (F) Hearing aids + Bluetooth system vs. Hearing aids alone. Black squares = summery effect size of each study for speech intelligibility. Error bars =95% confidence intervals (CI) for the summery effects. Diamond = overall effect size, lateral points indicate 95% CI for overall effect estimate.
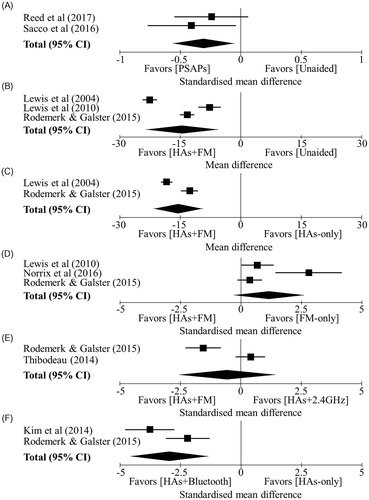
Table 1. Review authors’ judgements using Downs and Black (Citation1998) checklist to assess study quality for each included study, whereby higher scores indicate superior study quality (total maximum score of 28).