Figures & data
Table 1. Demographic characteristics of the participants.
Table 2. Summary of test procedures and standard errors of measurements (SEM) for speech recognition in quiet (65 and 55 dB) and noise (adaptive and fixed procedures).
Figure 1. Speech recognition in quiet measured in four different conditions across the three test sessions. In each test condition, CVC words were presented at 65 dB (left panel) and 55 dB (right panel), respectively. The symbols represent individual scores and the horizontal lines represent mean and ±1 standard deviations.
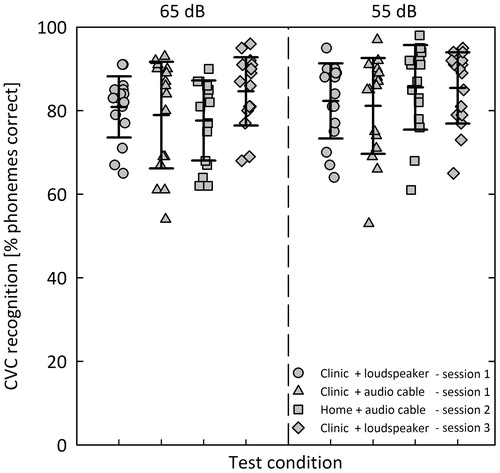
Table 3. Means and standard deviations (SD), and summary of paired samples t test results for speech recognition in quiet and in noise.
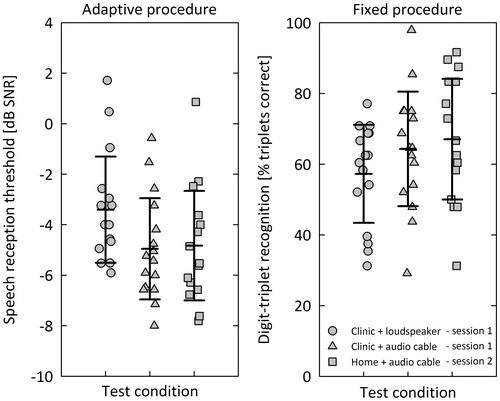
Figure 2. Speech recognition in noise measured in three different conditions using the adaptive (left panel) and fixed (right panel) procedures. The digits-in-noise test was used to obtain speech reception thresholds in dB SNR from the adaptive procedure and % triplets correct scores from the fixed procedure. The symbols represent individual scores and the horizontal lines represent mean and ±1 standard deviations.