Figures & data
Figure 1. Five steps in the patient journey, using synchronous (real-time) and asynchronous (store-and-forward) modes of service delivery website.
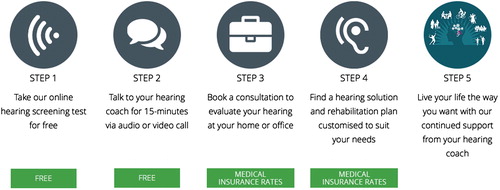
Table 1. Description of website traffic in the three-month study period (23rd June–22nd September 2017) obtained from Google Analytics for the greater Durban area.
Table 2. First language and self-reported English-speaking competency for participants in Step 1 (n = 462).
Table 3. Number of participants for each step of the patient journey at the end of the three-month study period (22nd September 2017).
Figure 2. Relationship of DIN test result (SNR) and age of participants who completed the DIN test (n = 462).
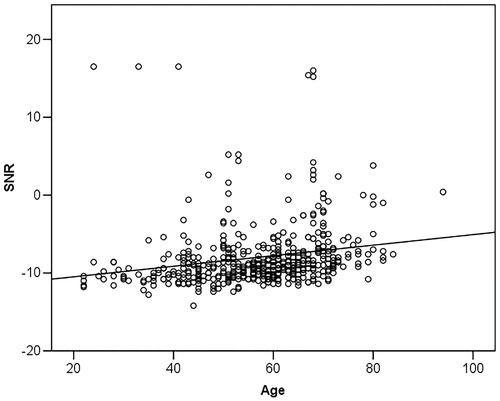
Table 4. Summary of themes that participants in Step 2 reported in regards to taking action towards Step 3 (n = 51).
Figure 3. Distribution of DIN tests completed per time of day (n = 462).
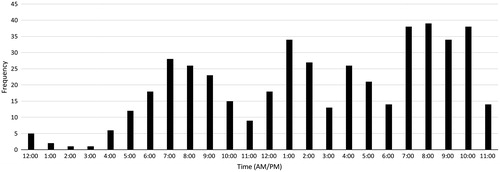
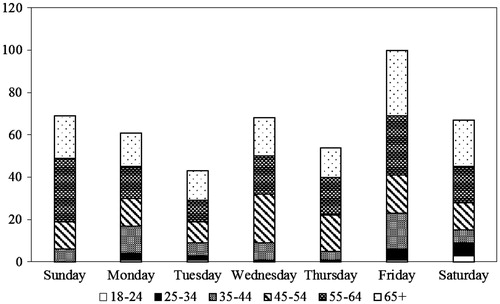
Figure 4. Distribution of DIN tests completed per age group and per day of the week (n = 462).