Figures & data
Table 1. Subject demographics.
Figure 1. Overview showing the Dα scores (y-axis) across the electrode contacts (x-axis) for all subjects. On top of each plot subject’s name and CVC score at 65 dB speech in quiet are shown. The CVC scores for subject S0408 and S0416 were unknown.
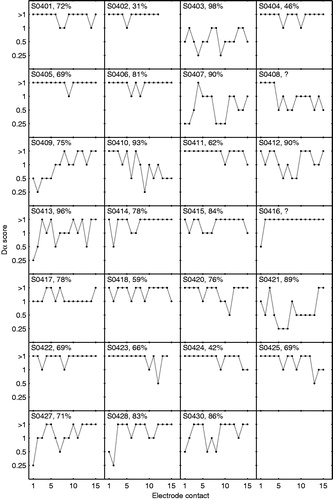
Figure 2. Figure showing the distribution of Dα scores across three regions of the electrode array. The apical region (dark grey) corresponds with electrode contact 1–5, the middle region (grey) with contact 6–10 and the basal region (light grey) with contact 11–15. On top of each column, the total number of Dα scores is shown.
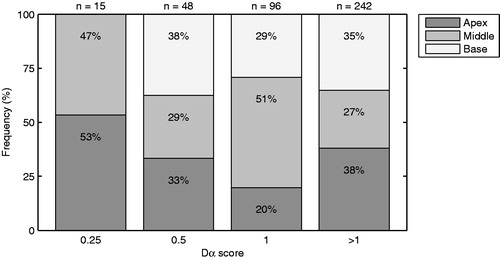
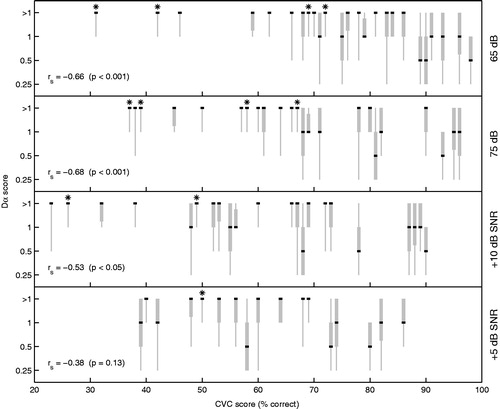
Figure 3. Boxplots showing the Dα scores across the electrode array (y-axis) as function of subject’s CVC score (x-axis). The grey vertical line shows the range from the Dα scores and the box represents the interquartile range (25–75%). The black line indicates the median. Spearman’s rank correlation (rs) was based on the median values. CVC scores were obtained in four different test conditions, resulting in one plot per condition (65 dB, 75 dB, +10 dB SNR and +5 dB SNR). Results from prelingually deafened CI users were marked with an asterisk to distinguish them from the postlinguals.