Figures & data
Table 1. Characterisation of the study population.
Figure 1. Mean right and left ear pure-tone thresholds and standard errors for all study groups. ✩★◆ denote significant differences at the p < 0.05 level between non-exposed control subjects and gasoline station workers with normal hearing, between non-exposed control subjects and gasoline station workers with hearing loss, and between gasoline station workers with normal hearing (SG1) and with hearing loss (SG2), respectively.
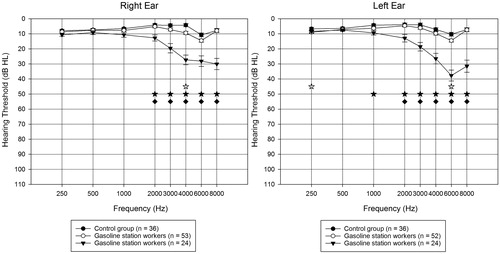
Table 2. Number of absent reflexes for the right and left ears and mean ipsilateral (ipsi) and contralateral (contra) acoustic reflex thresholds (ART) in dB HL with, standard deviation (SD) in parentheses organised by exposure group and test frequency (0.5, 1, 2 and 4 kHz).
Table 3. Mean ABR and P300 results with standard deviation (SD), for the right and left ears for the study groups (Study Group 1 (SG1) involves gasoline station workers with normal hearing. Study Group 2 (SG2) includes gasoline station workers with hearing loss; Control group (CG) includes individuals not exposed to noise or chemicals).
Figure 2. Means and standard errors for TEOAE signal to noise ratio (SNR) in dB for the right and left ear for both groups of participants. ✩★◆ Denote significant differences at the p < 0.05 level between non-exposed control subjects and gasoline station workers with normal hearing, between non-exposed control subjects and gasoline station workers with hearing loss, and between gasoline station workers with normal hearing and workers with hearing loss, respectively. (Open circle symbols denote gasoline station workers with normal hearing. Filled arrowhead symbols denote gasoline station workers with hearing loss).
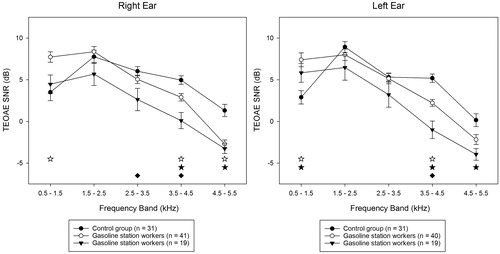
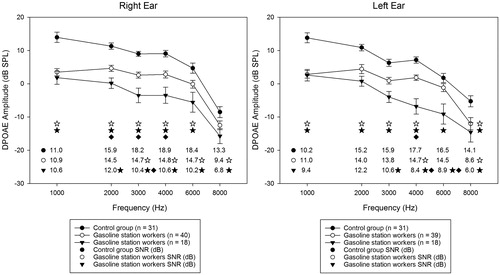
Figure 3. Means (± standard errors) for DPOAE amplitude (dB SPL) are shown with the connected symbols and mean DPOAE SNRs are shown numerically for each frequency for the right and left ears for all participant groups. ✩★◆ Denote significant differences at the p < 0.05 level between non-exposed control subjects and gasoline station workers with normal hearing, between non-exposed control subjects and gasoline station workers with hearing loss, and between gasoline station workers with normal hearing and those with hearing loss, respectively. (Open circle symbols denote gasoline station workers with normal hearing. Filled arrowhead symbols denote gasoline station workers with hearing loss).