Figures & data
Table 1. Demographic data of the 25 participants and their parents.
Table 2. Completed LEAQ questionnaires by age category of the participants (n = 25). The total number of questionnaires = 299, including 10–13 per participant over time.
Figure 1. Results from the repeated measures ANOVA with 25 participants divided into groups of two age months from 2–3 months, 4–5 months and so on to 22–24 months.
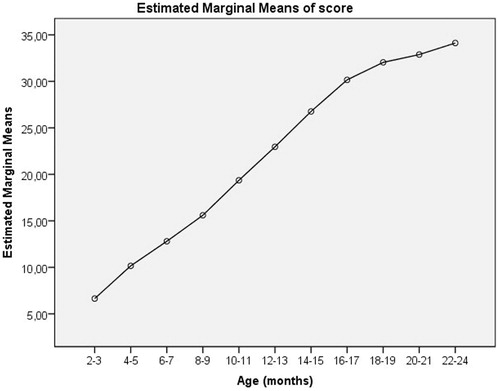
Figure 2. LittlEars validation data from Swedish normal hearing children and the German derived-norm curve. The solid line shows the Swedish normative curve derived through mixed regression model with random intercept and random slope (age) with a quadratic trend with the equation of = 1.0026 + 2.1543×x − 0.0298×x2. The bold dotted line shows the original German normative curve with the equation of = 2.0651 + 2.2175×x − 0.376×x2. The dotted black lines display the upper and lower confidence intervals of the Swedish sample. The circles represent the raw data of the 299 questionnaires of the 25 participants.
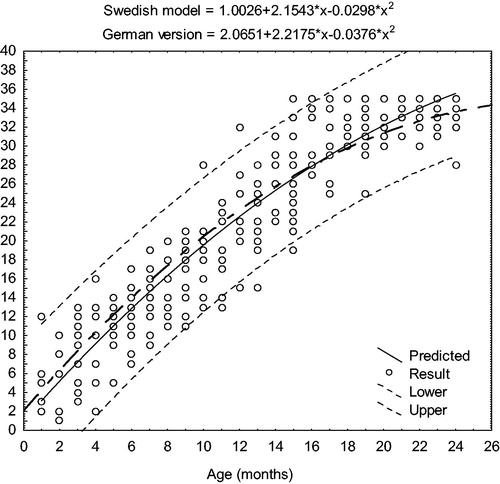
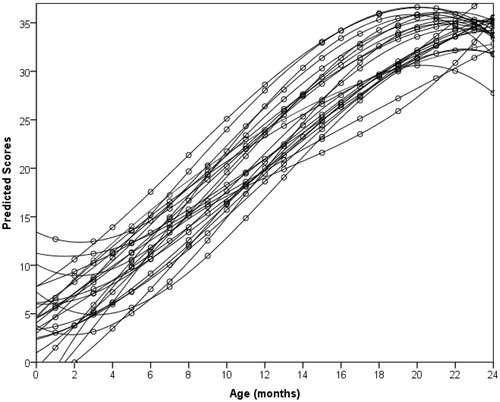
Figure 3. Predicted scores development over time of each participant estimated with mixed regression model (n = 25).