Figures & data
Table 1. Recipients biographical data. Stimulus rate reported in pulses per second (pps).
Figure 1. Schema of the test conditions comparing BEAM and ForwardFocus for the two speaker configurations and for the different noise types.
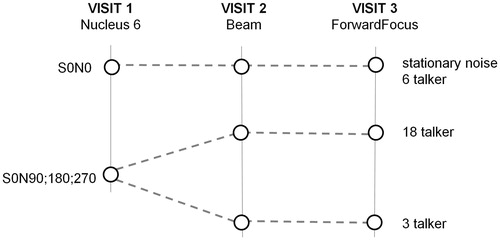
Figure 2. Boxplots of SRT for the Oldenburger sentences in S0N0 across different noise types for normal hearing participants and CI participants. CI recipient testing compared BEAM and ForwardFocus (FF) technologies, both using the same base default SmartSound technologies. Box plot shows median (solid mid line), 25th and 75th percentile interval (box limits), 5th and 95th percentile interval (whiskers). Mean values are also shown (squares).
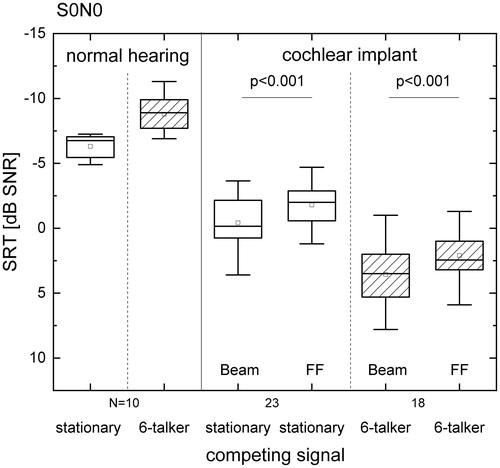
Figure 3. Boxplots of SRT for the Oldenburg sentences in S0N90; 180; 270 across different noise types for normal hearing participants and CI participants. CI recipient testing compared BEAM and ForwardFocus (FF) technologies, both using the same base default SmartSound technologies. Box plot shows median (solid mid line), 25th and 75th percentile interval (box limits), 5th and 95th percentile interval (whiskers). Mean values are also shown (squares).
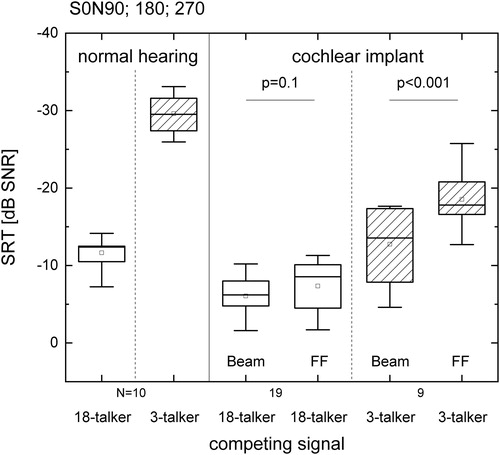
Figure 4. A summary of the different test conditions used in recent studies, all using the Oldenburg sentence test. Speaker configuration is presented on the y-axis, from noise from the front, through diffuse noise environments, to noise from behind. Competing signals are described by their crest factors. Median crest factors are indicated by ticks on the top x-axis together with their interquartile range.
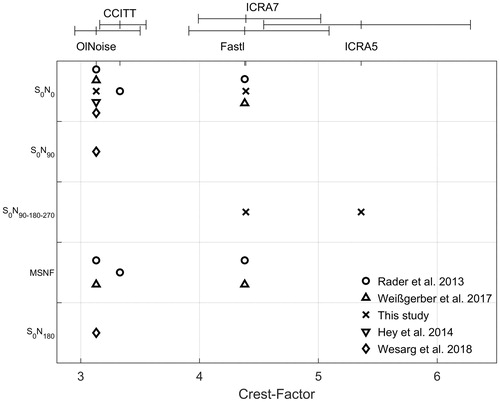
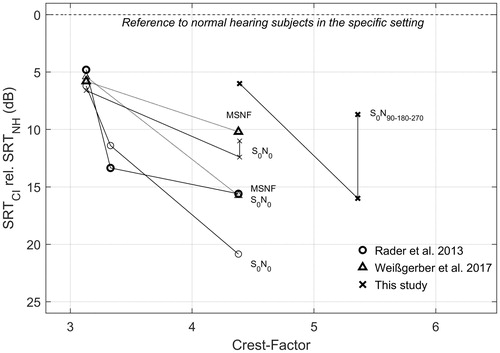
Figure 5. SRT results from this study and interpreted from two other studies plotted relative to performance of normal listeners in the same test environment. The x-axis shows the Crest Factor for each noise type. Spatial configuration of speakers is presented for each curve. All studies presented used the Oldenburg sentence test. Mean results are presented in all cases. Arrows marked with ForwardFocus (FF) indicate the improvement of FF compared to BEAM for the two spatial conditions. It should be noted that this study uses unilateral CI users compared to unilateral and normal listeners, where Rader et al. and Weissgerber et al. both refer to bilateral CI recipients compared to bilateral normal hearing listeners.