Figures & data
Figure 1. Diagram showing present modalities of bone conduction devices that can be either directly attached to the skull bone (Direct bone drive) or applied over the intact skin (Over skin drive).
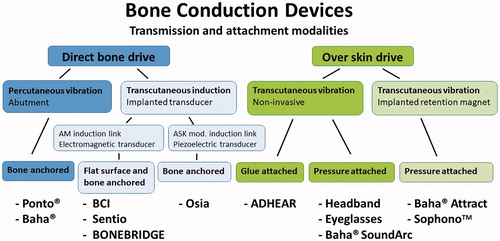
Figure 2. The BCI system (left) consists of an external audio processor which includes a digital sound processor (DSP) that drives a power amplifier (PA) and an amplitude modulation (AM) induction link connected to the transducer secured in a recess of the mastoid portion of the temporal bone. The audio processor is held in place by magnets (N and S poles) over the implanted unit called the Bridging Bone Conductor. Sizes of the Bridging Bone Conductor are shown in the middle and the real appearance, including the audio processor to the right.
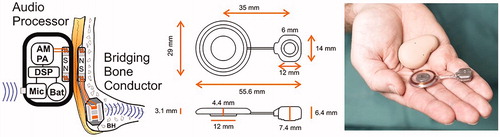
Table 1. Demographic data and hearing thresholds of included patients.
Figure 3. Positioning of the Bridging Bone Conductor (BBC) behind the ear (a) and the transducer in a prepared recess secured by a titanium wire. (b) The transducer casing in patient 1 was secured by a flexible titanium plate with screws at the ends, whereas in patient 2–16 it was secured by a thin titanium wire.
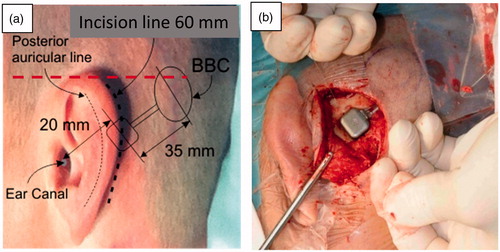
Figure 4. (a) Frequency responses of individual audio processors at 60 dB SPL input, average response at 60 and 90 dB SPL input, and maximum dynamic range of the system determined by MFO minus noise floor (vertical lines at 0.5, 1, 2 and 4 kHz) and (b) illustrates the audibility of average ordinary speech corresponding to a 70 dB overall long term average speech spectrum (LTASS) including peak and valley levels giving a 30 dB speech dynamic range (transformed from SPL to force level) as well as the clinical dynamic range dB for these patients determined by MFO minus thresholds.
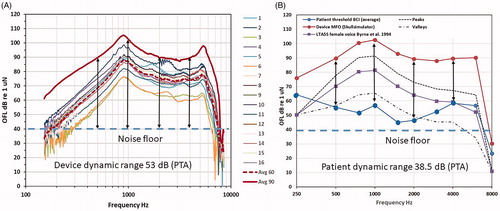
Figure 5. (a) Warble tone threshold improvements for BCI and reference device compared to the unaided situation (baseline at 0 dB), with mean and standard deviations. Stars are included at frequencies where the BCI or the Ref device has statistically higher improvement than the other device (α < 0.05). (b) Speech Recognition Threshold (SRT) improvements for BCI and reference device (Ref) over the unaided condition for all patients. The rightmost column shows mean improvement and standard deviation.
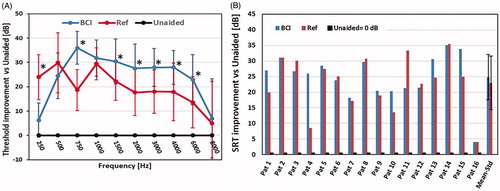
Figure 6. (a) Speech Recognition Score (SRS) improvements for BCI and reference (Ref) device over the unaided condition for all patients. The rightmost column shows mean improvement and standard deviation. (b) Signal-to-noise ratio threshold (SNR-threshold) for 50% intelligibility for the BCI and the reference (Ref) device for all patients. The rightmost column shows mean improvement and standard deviation.
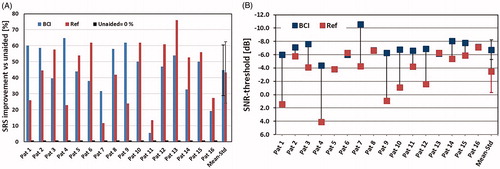
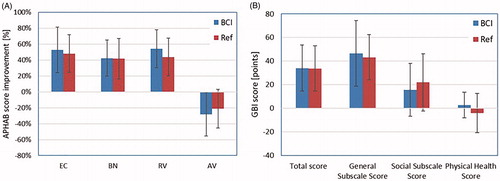
Figure 7. (a) APHAB improvements in the four categories (ease of communication (EC), listening against background noise (BN), listening under reverberant conditions (RV), and aversiveness of sound (AV)) for the BCI and for the reference device (Ref). (b) GBI results in the categories total score, general subscale score, social support score and physical health score. Results for both the BCI and the reference device (Ref) are presented. Results show the mean improvement and standard deviation.