Figures & data
Table 1. Description of the 70 participants.
Figure 1. Box-plot of speech identification (monosyllabic words with phoneme scoring) scores for the Neuro One and the Neuro 2 sound processors in quiet and in noise in adults. The middle line represents the median, the + sign, the mean, the lower and upper boundaries of the boxes, the 25th and 75th percentiles, the whiskers, the 5th and 95th percentiles, and the dots, the outliers. As some data were missing, the number of data points is reported.
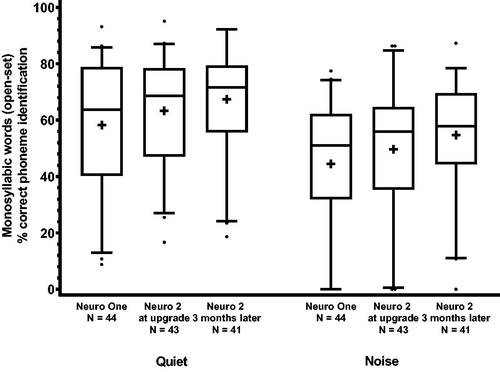
Figure 2. Box-plot of self-reported listening ability scores for the Neuro One and the Neuro 2 sound processors for the three factors, combined for adults and children. The middle line represents the median, the + sign, the mean, the lower and upper boundaries of the boxes, the 25th and 75th percentiles, the whiskers, the 5th and 95th percentiles, and the dots, the outliers. As some data were missing, the number of data points is reported.
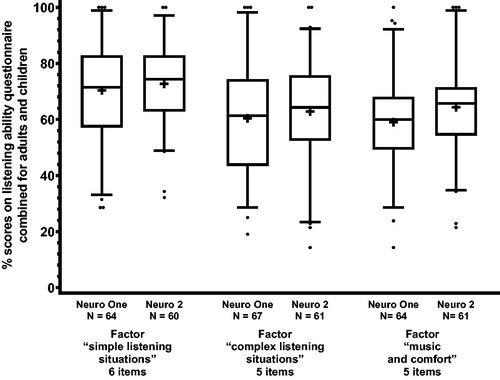
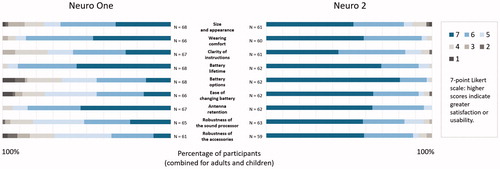
Figure 3. Satisfaction and usability scores for the Neuro One and the Neuro 2 sound processors, combined for adults and children. As some data were missing, the number of data points is reported.