Figures & data
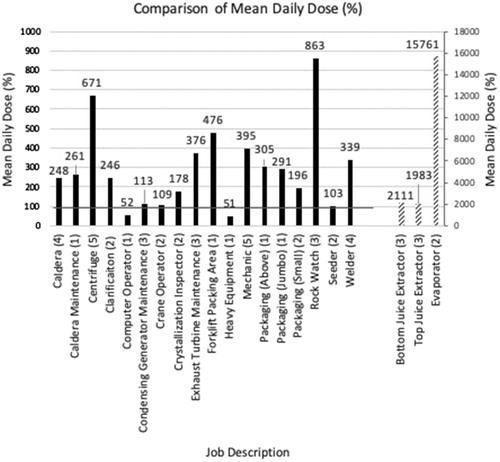
Figure 1. Diagram of sugar refining process annotated with job numbers referenced in results section. Adapted from Pantaleon Diagram of the Industrial Process at https://www.pantaleon.com/procesos/industrial-process/.
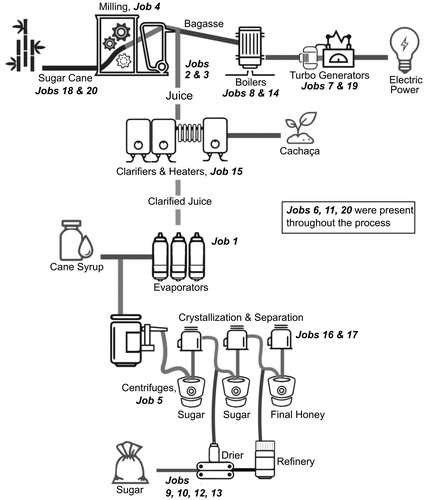
Table 1. Summary of seasonal noise exposure per job description.
Figure 2. Mean daily noise dose reported by job category. Dose is the amount of actual noise exposure relative to the amount of allowable exposure, and for which 100% and above represents exposures that are hazardous. Right y-axis provides an extended scale for the Juice Extractor and Evaporator job classifications.