Figures & data
Figure 1. DRILCOM testing facility and participant interface demonstrating the 12 response location options and system-generated feedback for an incorrect response. Adapted from Casali and Lee (Citation2019), Figure 1, pS67 and Figure 3, pS69.
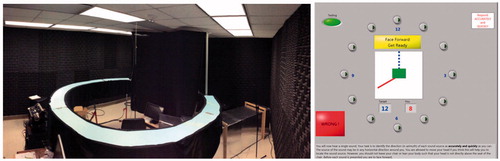
Table 1. Subunit composition for each training condition in the main experiment.
Figure 2. Spectral content of the dissonant training signal and untrained stimuli as used in both pilot experiments and main experiment (explanations in text).
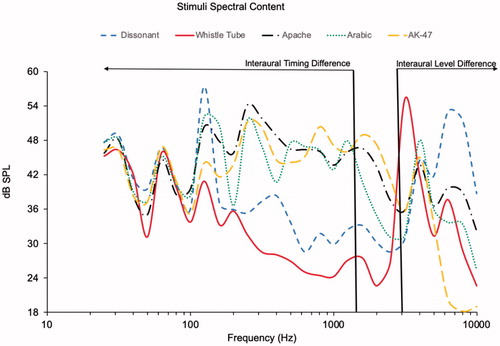
Figure 3. Mean score for each presentation condition at each training stage for Pilot Experiment 1 and Pilot Experiment 2.
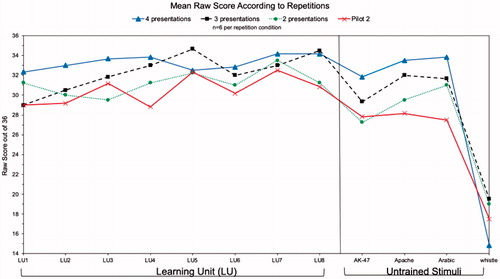
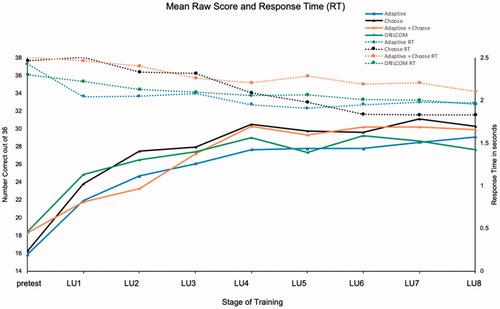
Figure 4. Mean raw scores and response times across Learning Units for each training condition.