
Figures & data
Table 1. Characteristics of the CI recipients.
Figure 1. Speech reception thresholds in noise (SRTn) and Acceptable noise levels (ANL) for CI users and NH listeners. Lower SRTn and ANL values indicate better performance. Error bars indicate the standard deviation. Numbers of mean and SD are given below the bars.
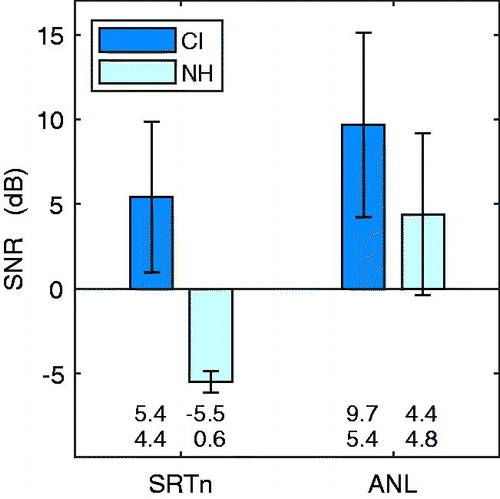
Figure 2. Proportion of correct words from sentences in quiet (PCq) plotted against the Speech Reception Thresholds in noise (SRTn), obtained with word scoring (left panel), together with a regression line. The y-axis on the left shows the proportion correct in rau units and the y-axis on the right of the left panel gives the proportion correct scores. The black square shows the normal-hearing reference value. The right panel shows the intelligibility function of four groups of CI users and the NH reference. The grey area is the area with ecological SNRs.
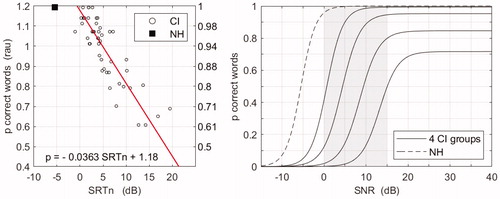
Table 2. Correlation matrix with Pearson correlation coefficients and corrected significance levels for proportion of correct CVC words (PCcvc), proportion of correct words from sentences in quiet (PCq), speech reception threshold in noise (SRTn) and acceptable noise level (ANL) as measured in the CI group.
Figure 3. Acceptable noise levels (ANL) compared with Speech reception thresholds in noise (SRTn), together with a regression line.
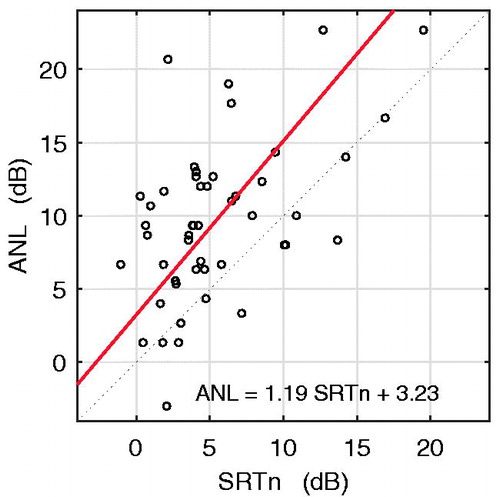
Figure 4. Mean values on the speech and qualities scales and pragmatic subscales of the Speech, spatial and qualities (SSQ) questionnaire for the CI group and the NH group. Error bars indicate the standard deviation. Numbers of mean and SD are given below the bars.
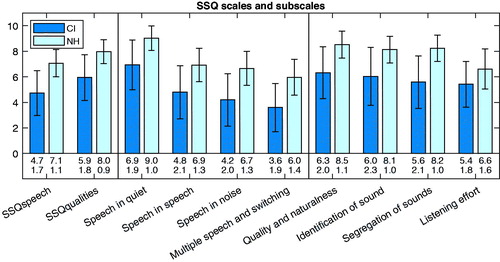
Table 3. Correlation matrix with Spearman correlation coefficients for proportion of correct CVC words (PCcvc), proportion of correct words from sentences in quiet (PCq), speech reception threshold in noise (SRTn), and Acceptable noise level (ANL) as measured in the CI group.
Figure 5. Relations of SSQ speech and SSQ quality with the speech reception threshold in noise (SRTn) and the acceptable noise level (ANL), together with fitted regression lines.
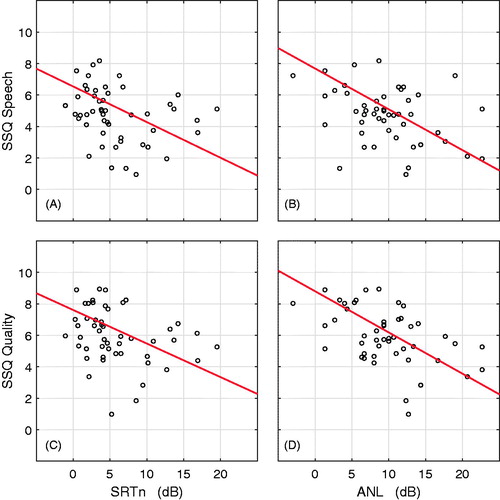
Table 4. Prediction of SSQ Speech and Qualities by proportion of correct CVC words (PCcvc), proportion of correct words from sentences in quiet (PCq), speech reception threshold in noise (SRTn) and acceptable noise level (ANL) as measured in the CI group.