
Figures & data
Figure 1. Mean pure-tone thresholds for air and bone conduction audiometry by test ear, test frequency and gender. Air and bone conduction thresholds do not differ by more than 10 dB, consistent with sensorineural hearing loss.
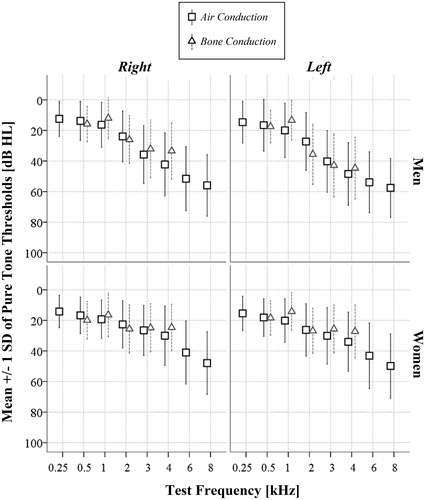
Table 1. Distribution of hearing loss degrees and audiogram configurations by ear and gender.
Figure 2. Prevalence of cochlear dysfunction determined with DPOAE, by test frequency and gender, in an unscreened population-based sample of 70-year old persons (n = 244). The data labels refer to the present and abnormal and absent categories added together.
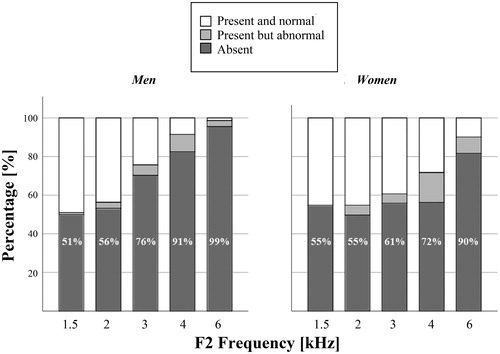
Table 2. Descriptive statistics for the speech in noise test, DPOAE and ABR.
Figure 3. Stacked histogram of the pure-tone thresholds at F2 clustered on whether the DPOAE at that frequency was present or not. In the vast majority of measurements, DPOAEs classified as present and normal are associated with hearing thresholds of 40 dB HL or less. However, DPOAEs classified as abnormal (grey categories) are common across the x-axis, demonstrating that it would be difficult to predict the audiogram based on DPOAE testing in this age group.
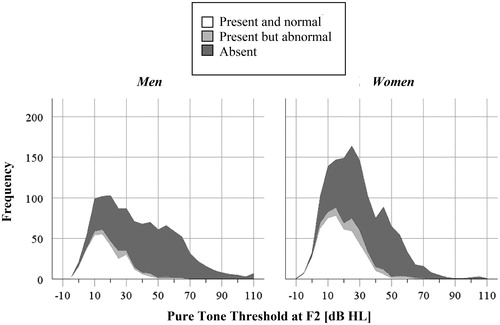
Figure 4. Mean ABR latencies for waves I, III and V by hearing loss severity and gender for left and right ear separately (n = 246). The error bars show the 95% confidence intervals around the mean. The severe hearing loss category only contains a few observations; therefore, the error bars have been omitted. None of the women had severe loss in the right ear.
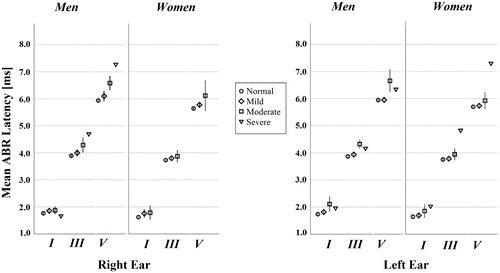
Table 3. Factors associated with speech in noise recognition, in right and left ear separately.
Table 4. Estimates of the prevalence for various observed and self-reported specific ear and hearing related diagnoses by gender and ear.