
Figures & data
Figure 1. Schematic showing the structure of trial presentation and response. Panel A shows the three intervals being visually cued over time. Panel B shows the feedback given for a correct response and a summary of how the sound frequency for the next trial is changed based upon the responses of previous trials.
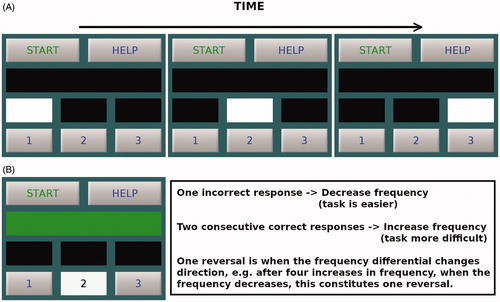
Table 1. Average thresholds across the two measurement methods are shown along with standard deviations and the coefficient of variation for each measure.
Figure 2. Average thresholds (shown in dB SPL for ease of comparison) across the full cohort are shown for the 6 frequencies tested in the conventional range and the 4 EHFs using standard PTA methodology (circles). The squares denote the average FLFTs at 40 and 70 dB SPL. Error bars show 95% confidence intervals.
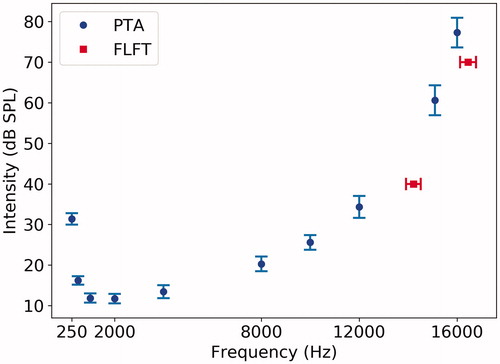
Table 2. Spearman correlation coefficients between standard PTA thresholds (measured in dB HL) and FLFTs (measured in Hz) at 40 and 70 dB.
Table 3. Spearman correlation coefficients across standard PTA thresholds (dB HL).