
Figures & data
Figure 1. A picture showing how the CAVA® device looks when worn on the face. The device consists of a reusable logging module that sits behind the left ear, and two single-use electrode mounts that attach to the face by way of five ECG electrode pads. Two electrode pads are placed at the outer canthi of each eye to record horizontal eye movements, and two are placed above and below one eye to record vertical eye movements. A fifth electrode beneath the right ear provides a reference voltage.
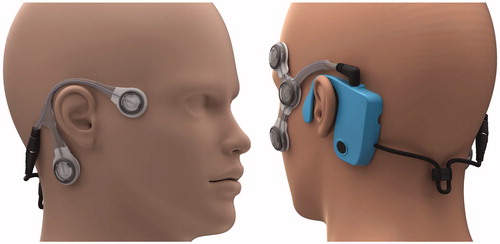
Figure 2. A thirty-second horizontal eye-movement trace from each of the eight separate episodes observed within the three-hour attack. Each trace is shown on the same x and y scales to aid comparison, although the y-scale is shifted appropriately to display the waveform in the centre of the panel. The nystagmus beats were automatically detected by a computer algorithm and then manually validated by an expert. Fast and slow phases are shown in red and green respectively.
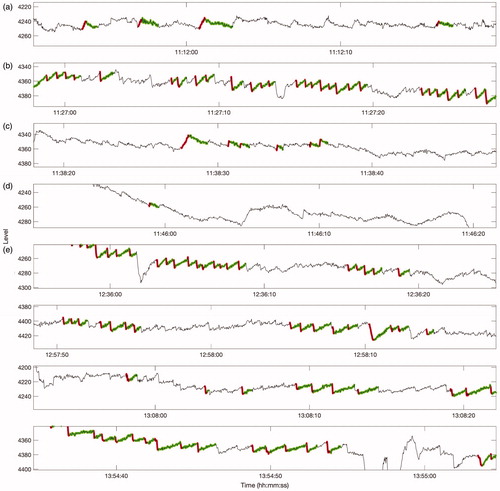
Figure 3. (a) Periods of right-beating and left-beating nystagmus are highlighted in red shaded and green shaded areas respectively. The duration of these periods was determined by manual inspection. Beats occuring within five minutes of each other were considered to be part of the same episode. Arrows mark the time at which the patient activated the device’s event maker, and the approximate start and end times of the attack as recorded in the patient’s trial diary. (b) Estimated mean and standard error of the slow phase velocities of the nystagmus in each episode. (c) Estimated mean and standard error of the fast phase amplitudes in each episode. (d) Estimated mean and standard error of the slow phase durations of each episode.
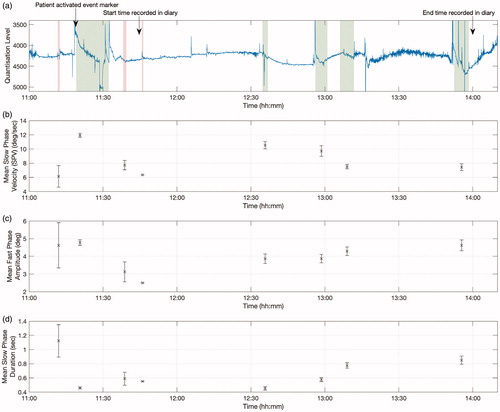
Table 1. Quantification of the nystagmus episodes within a three-hour, acute Ménière’s attack. The last three columns show the mean and standard error for their respective measures. This table relates to the episodes shown in and .
Data availability statement
The data presented here is available upon reasonable request.