
Figures & data
Figure 1. Histogram showing initial self-fit (ISF) personal attenuation ratings (PARs) in decibels (dB) achieved (i.e. baseline) for all recruits by percent (n = 798). Note: Not included here are the ISF PAR values of the 23 participants who were excluded. The solid vertical line indicates the study pass-fail criterion level of 25.0 dB.
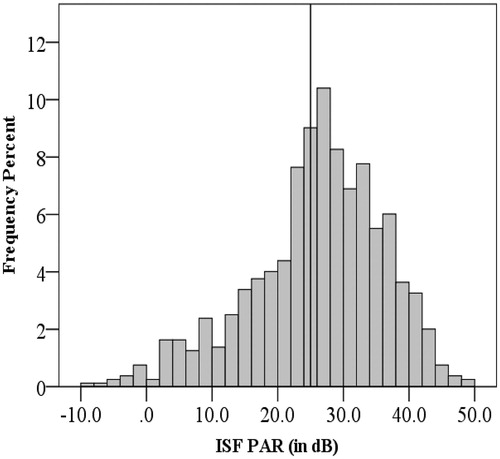
Figure 2. Study design flow chart. Note. Of the 344 participants who qualified, 341 were randomly assigned a training method. A total of 20 participants were excluded during training for various reasons (e.g., use of an alternate earplug [current n = 2, eHPD n = 5, integrated n = 4], an expert fit PAR value < 25.0 dB [eHPD n = 4, integrated n = 3), and not completing the assigned training [integrated n = 2], which resulted in a data set of 321 participants (i.e., current n = 111, eHPD n = 105, integrated n = 105).
![Figure 2. Study design flow chart. Note. Of the 344 participants who qualified, 341 were randomly assigned a training method. A total of 20 participants were excluded during training for various reasons (e.g., use of an alternate earplug [current n = 2, eHPD n = 5, integrated n = 4], an expert fit PAR value < 25.0 dB [eHPD n = 4, integrated n = 3), and not completing the assigned training [integrated n = 2], which resulted in a data set of 321 participants (i.e., current n = 111, eHPD n = 105, integrated n = 105).](/cms/asset/a268437f-50b3-42d3-8cea-ae2f19519064/iija_a_1811407_f0002_b.jpg)
Table 1. Pass/fail rate by training method pre- and post-training.
Figure 3. Attenuation achieved by participant rank ordered by ISF PAR values. Three figures are provided one for each training format: (A) current (n = 111), (B) eHPD (n = 105), and (C) integrated (n = 105). Note. PAR values obtained for ISF (diamonds), EF (triangles), SRF (circles), target PAR (horizontal dark solid line, 25.0 dB), and earplug NRR (horizontal dashed line, 33.0 dB) are shown. Each vertical line connects the PAR values for an individual participant.
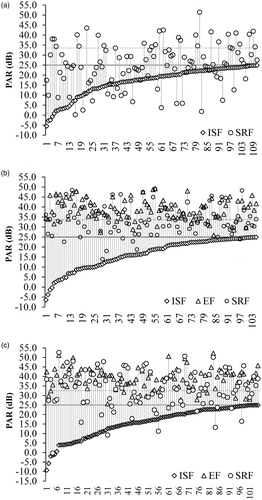
Table 2. Means and standard deviations of measured PAR values and Delta PAR.