Figures & data
Figure 1. The distribution of the audiograms for the sixteen subjects. Whiskers mark minimum and maximum values.
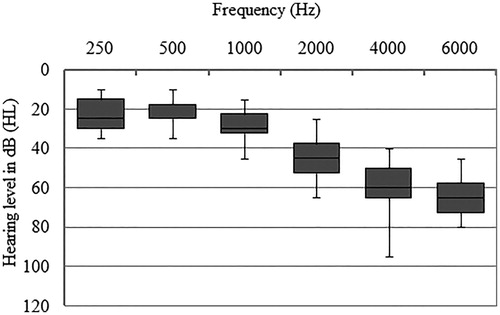
Figure 2. Bark spectrum of the three test signals at 65 dB SPL.
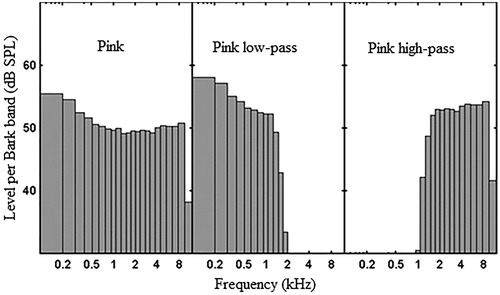
Table 1. Overview of the fifteen pairs of low-pass filtered (LP), high-pass filtered (HP) and broadband (BB) pink noise signals that were matched in this study. The columns show the reference signals and the rows the test signals.
Figure 3. LDEL at a loudness level of 35 CU for unilateral and bilateral presentation. Diamonds represent loudness scaling data, and triangles represent loudness matching data. The first signal is the test signal, and the second signal the reference signal. Positive values indicate that the test signal reaches equal loudness at a higher level than the reference signal. The error bars indicate the standard error of the average spectral loudness effect across all sixteen hearing-impaired subjects.
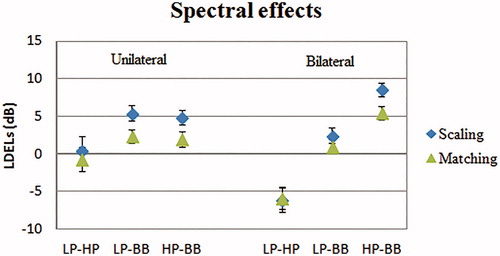
Figure 4. Absolute values for the level at which the signal is perceived to have a loudness equal to 35 CU. The levels for loudness matching are plotted as a function of the levels for loudness scaling with each marker representing one subject.
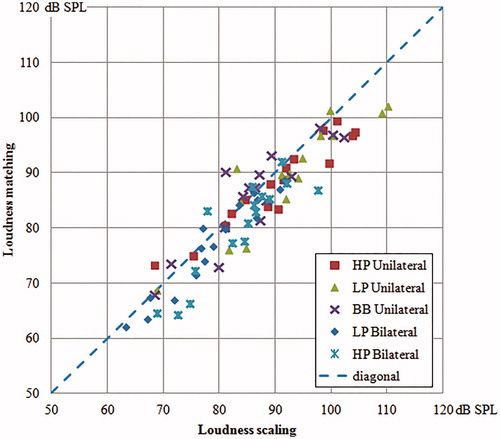
Figure 5. LDEL between unilateral and bilateral presentation for the three signals.
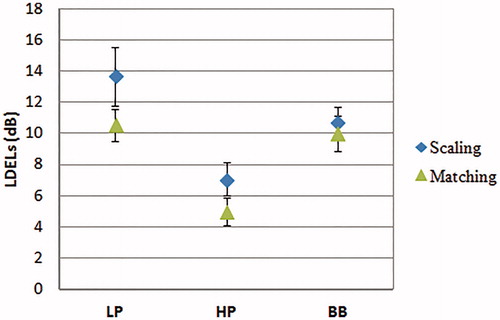
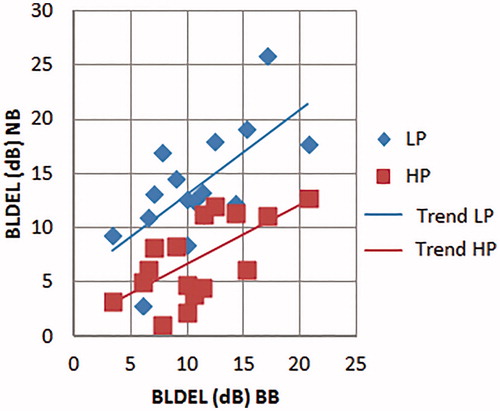
Figure 6. BLDEL are shown for LP noise and HP noise as a function of the BLDEL for BB noise. Trend lines are added for clarity. Each marker represents a single subject.