Figures & data
Figure 1. Flowchart of the study. Phase 2 was optional and included a baseline period (without sound therapy) of at least 2 weeks with a maximum duration of 3 weeks, followed by a take-home evaluation (with sound therapy) of at least 5 weeks with a maximum duration of 6 weeks. CART: Cochlear™ Active Relief from Tinnitus.
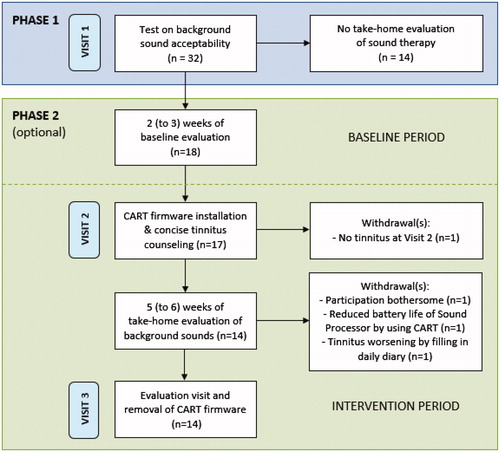
Table 2. Background sound use in phase 2.
Table 1. Subject demographics.
Figure 2. VAS on tinnitus annoyance and loudness. Baseline = individual scores averaged across 2 weeks without use of sound therapy; Intervention = individual scores averaged across five weeks with use of sound therapy. *p < 0.05, †Participant withdrew from the study and did not complete phase 2 (no data of baseline and/or intervention period), ‡Calculated for the 14 participants that completed phase 2. VAS: Visual Analogue Scale.
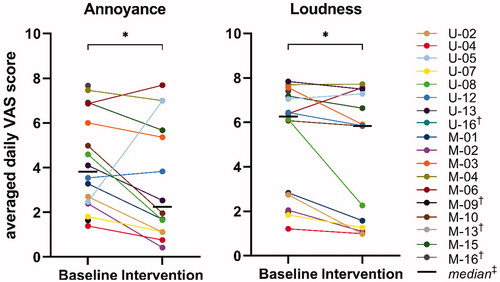
Figure 3. Tinnitus Functional Index (TFI). Baseline = individual scores averaged across two weeks without use of sound therapy; Intervention = individual scores averaged across five weeks with use of sound therapy. †Participant withdrew from the study and did not complete phase 2 (no data of baseline and/or intervention period), ‡Calculated for the 14 participants that completed phase 2.
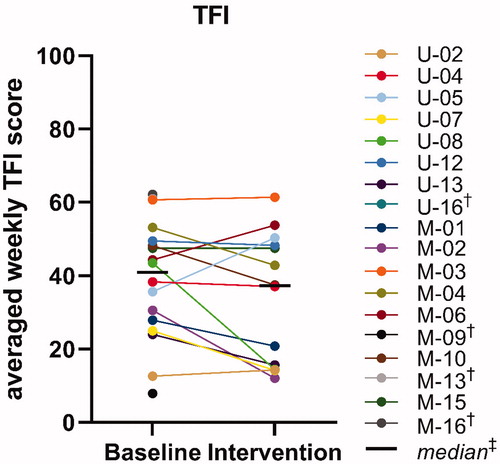
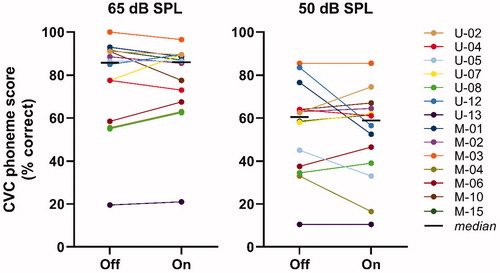
Figure 4. Speech perception in quiet was tested at 65 and 50 dB SPL with participant’s most preferred background sound off and on, using open-set Dutch consonant-vowel-consonant (CVC) monosyllabic words in a free-field-condition in a sound-treated booth.