
Figures & data
Table 1. Participant characteristics.
Table 2. Theme mean (SD) scores, by participant type, and comparison between the participant groups means using Mann–Whitney test with Bonferroni corrected p values below 0.007 indicating statistical significance.
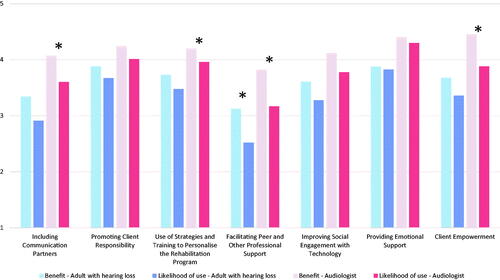
Figure 1. Comparison perceived benefit against perceived likelihood of use for participant mean rating scores for each theme (participant groups analysed separately). Significant differences denoted by *, calculated using independent t-tests with Bonferroni corrected p values below 0.007 indicating significance.
Supplemental material