
Figures & data
Table 1. CI-specific details for study group (FF-SRT measurement with NBN) and control group selected for comparison to normal-hearing listeners (FF-SRT measurement with NBN and WBN).
Figure 1. Impedance change for a sequence of increasing and decreasing stimulus intensities (up/down procedure) according to Stephan and Welzl-Müller (2000). The number above each box indicates the stimulus level respectively [charge units qu]. Boxes highlighted in green indicate the impedance change due to the stapedius reflex. The ESRT could be first elicited (increasing stimulus intensity) and disappeared (decreasing stimulation intensity) at a stimulation charge of 15.11qu in this example.
![Figure 1. Impedance change for a sequence of increasing and decreasing stimulus intensities (up/down procedure) according to Stephan and Welzl-Müller (2000). The number above each box indicates the stimulus level respectively [charge units qu]. Boxes highlighted in green indicate the impedance change due to the stapedius reflex. The ESRT could be first elicited (increasing stimulus intensity) and disappeared (decreasing stimulation intensity) at a stimulation charge of 15.11qu in this example.](/cms/asset/5fbe4844-ecc7-40ef-839e-164f58f58641/iija_a_1866780_f0001_c.jpg)
Figure 2. Measurement of free field stapedius reflexes of CI patients for NBN)with increasing stimulus intensities ranging from 65 dB HL to 95 dB HL for 0.5 kHz and ranging from 65 dB HL to 100 dB HL for 1, 2 and 4 kHz. The boxes show impedance change. Green highlighted boxes indicate the impedance change due to the stapedius reflex. The free field stapedius reflex threshold is 90, 90, 85 and 80 dB HL at frequencies 0.5, 1, 2 and 4 kHz.
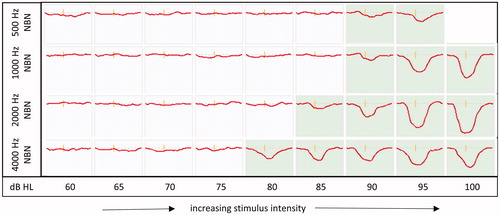
Figure 3. Mean and standard deviation of ESRT-based maps (N = 34 patients) with maximum level of the electric dynamic range (MCL) = based on ESRT estimation and psychoacoustically determined THRs, which remained unchanged compared to the used map.
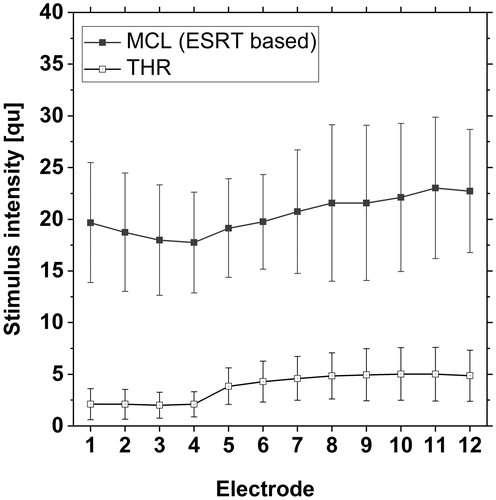
Figure 4. Mean and standard deviation of FF-SRTs of ESRT-based maps, shown in (N = 34 patients). Box plot shows median (solid mid line), 25th and 75th percentile interval (box limits), the 5th and 95th percentile (whiskers), and mean values (squares).
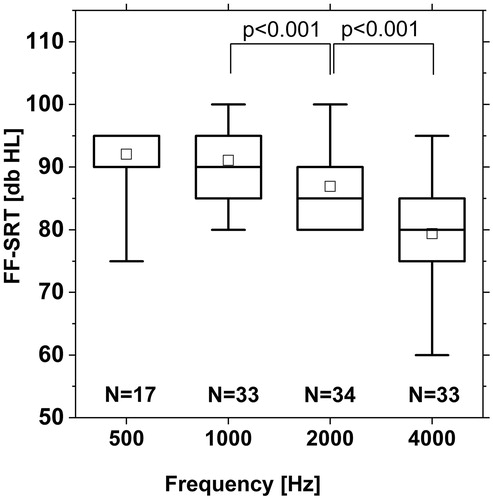
Figure 5. FF-SRTs of CI patients using ESRT-based maps (N = 10) for NBN with centre frequencies of 0.5, 1, 2, and 4 kHz and WBN (acoustic presentation via loudspeaker). Box plot shows median (solid mid line), 25th and 75th percentile interval (box limits), the 5th and 95th percentile (whiskers), and mean values (squares).
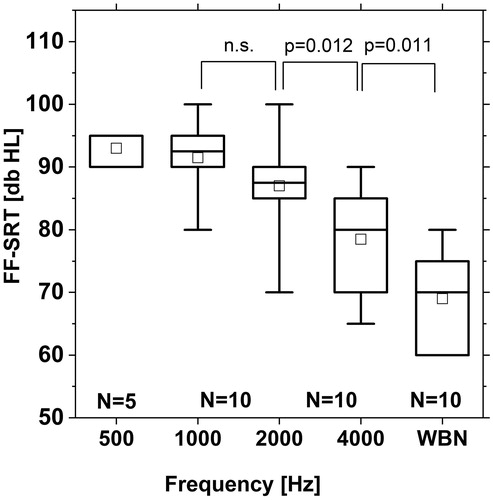
Figure 6. FF-SRTs of normal hearing subjects (N = 10 for NBN with centre frequencies of 0.5, 1, 2, and 4 kHz and WBN (acoustic presentation via loudspeaker). Box plot shows median (solid mid line), 25th and 75th percentile interval (box limits), the 5th and 95th percentile (whiskers), and mean values (squares).
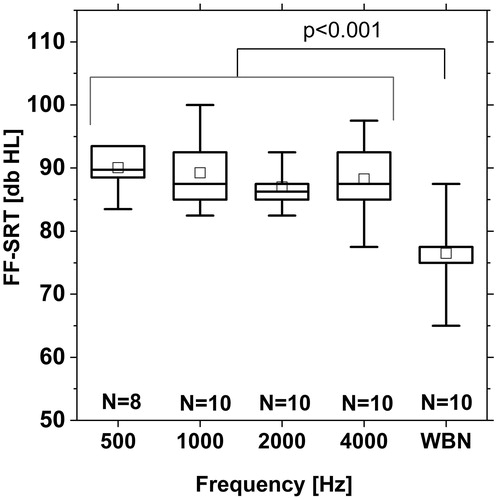
Figure 7. Change of FF-SRT in response to the change of MCL relative to MCL of the initial map for different NBN bursts with centre frequencies of 0.5, 1, 2, and 4 kHz, and for WBN. a) Example shown for one patient; b) Linear regression line based on data of N = 4 patients. Slopes of regression line increase for increasing centre frequency of NBN, except for 2 and 4 kHz with nearly identical regression lines. Details of the linear regression are shown in .
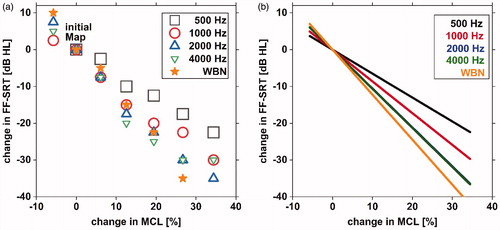
Table 2. Slope, standard error, and Pearson regression coefficient of regression lines presented in .
Table 3. t-value and significance level of paired t-test comparing slopes of neighbouring regression lines presented in .