
Figures & data
Figure 1. Flow chart of the verification and validation process.
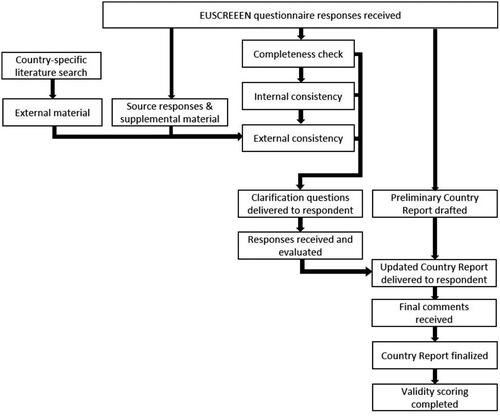
Table 1. Annual births for each country or region, validity of selected quality measures, and data collection process for each participating country or region.
Figure 2. Results of the validation scoring for coverage rate, referral rate to diagnostic assessment, follow-up rate to diagnostic assessment, and detection rate of permanent hearing impairment. Data were considered valid when source data were recent, representative of the target population, met the minimum sample size criteria, and consistent with the source or external literature. Out of the 47 participating countries or regions, the number are displayed with valid data, not valid data, or none provided. Five countries did not have a permanently established NHS programme. Note that the exact definition of each measure may vary across programmes, as NHS programmes could only report on the values that they themselves calculate. Notably, more valid data could be provided on coverage and referral rates compared to follow-up or detection rates.
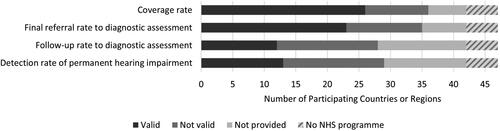
Figure 3. Percentage of infants referred out of the total population screened from each step and to diagnostic assessment, grouped by the reported NHS protocol for low-risk infants. For some programmes data for all steps could not be reported. Low-risk infants are defined as infants without an increased risk for HI or retrocochlear dysfunction as per the risk factors specified by each NHS protocol. Error bars represent 95% confidence intervals. Because most infants without hearing impairment pass step 1, a large reduction of referral rate is seen between steps 1 and 2. Programmes with more steps and using aABR had lower final referral rates.
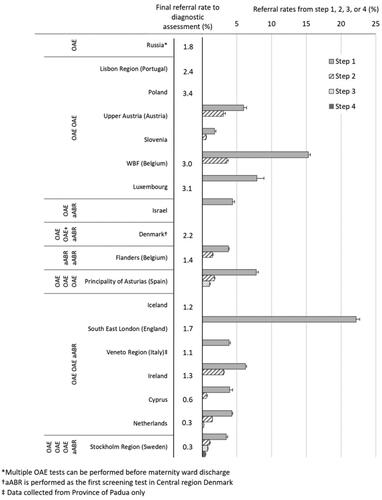
Table 2. Pooled final referral rates (%) to diagnostic assessment for groups of programmes based on protocol design for low-risk infants (middle column).