
Figures & data
Figure 1. Better ear audiometric threshold versus performance on the digits in noise test.
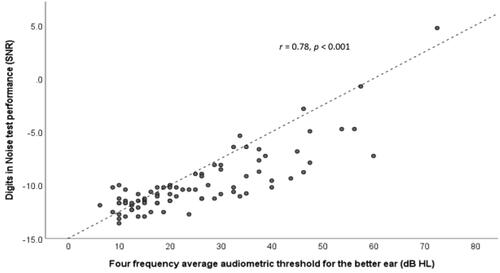
Figure 2. Percentage of UK adults aged 50–74 years as a function of (i) hearing loss at 0.5, 1, 2 and 4 kHz in the better ear using a criterion of 35 dB HL or greater (reported by Davis et al. Citation2007); (ii) took the internet hearing test; (iii) failed the internet hearing test (indicating hearing loss of 35 dB HL or greater).
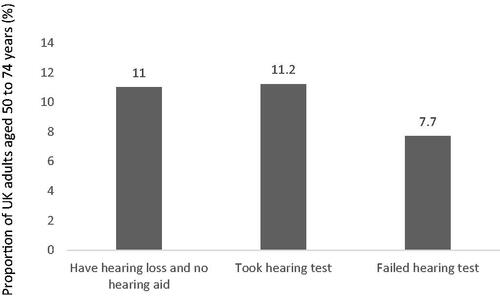
Table 1. Sample demographics for the uptake study, including those who took the hearing test and those who did not take the hearing test.