
Figures & data
Figure 1. Measurement setup visualised from two perspectives. P1 indicates the position of the remote microphone, and P2 the position of the user.
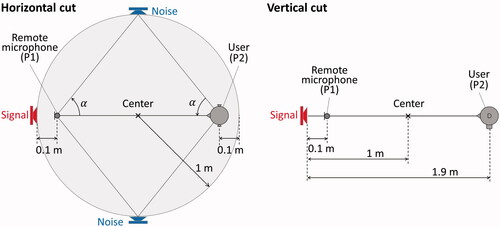
Figure 2. Speech (underlined) and noise levels for the measurement without wireless remote microphone system (WRMS) (a) and for the measurement with WRMS (b).
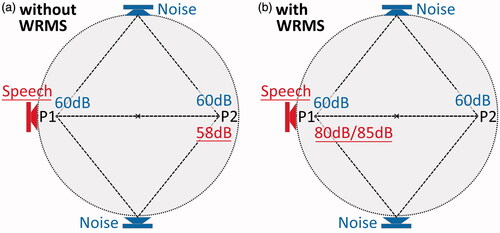
Figure 3. (a) Photograph of realisation of the simplified setup (left) and photograph of the position of the remote microphone (right). (b) Schematic drawing (left) and photograph of the classroom used for the measurements.
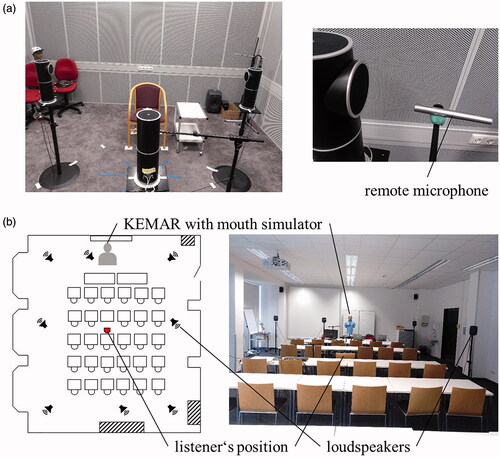
Table 1. Five different measurement conditions were considered in each test room (simplified setup/classroom) with and without wireless remote microphones system (WRMS) and with an omnidirectional or directional hearing aid microphone characteristic.
Figure 4. Speech intelligibility for all conditions (C1–C5 as listed in ) and for the classroom (CL) and the simplified setup (SS). The conditions with WRMS are indicated with a grey background.
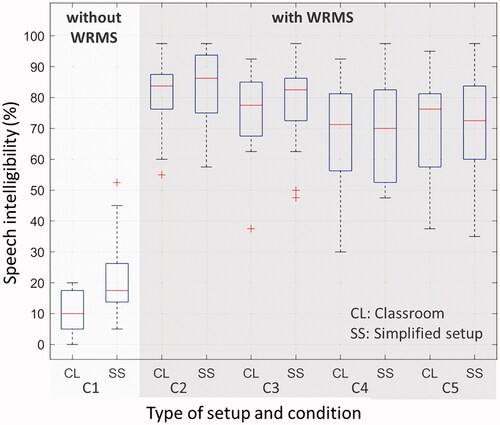
Table 2. Results of the post-hoc pairwise comparison with Bonferroni correction for all conditions (C1–C5) between the classroom (CL) and the simplified setup (SS).
Table 3. Results of the post-hoc pairwise comparison with Bonferroni correction for both rooms (CL or SS) between all conditions (C1–C5).
Table 4. Overview about the five different WRMSs tested.
Figure 5. (a) Speech intelligibility for all five WRMSs (W1–W5) and two noise levels. (b) Ratings of speech intelligibility and sound quality for a noise level of 65 dB SPL.
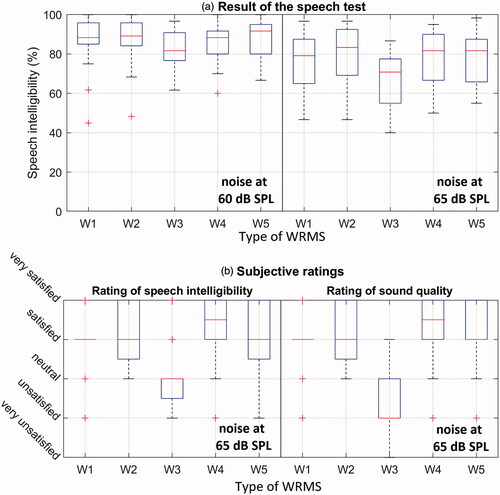
Table 5. Results of the post-hoc pairwise comparison with Bonferroni correction for both noise levels (60 dB or 65 dB SPL) between all conditions WRMSs (W1–W5).
Table 6. Results of the post-hoc pairwise comparison with Bonferroni correction for all WRMSs (W1–W5) between the situation with a noise level of 60 dB SPL and 65 dB SPL.
Table 7. Result of Friedman’s test performed on the data of the subjective ratings on speech intelligibility (SI) and sound quality (SQ) shown in .
Table 8. Results of the post-hoc pairwise comparison with Bonferroni correction for the subjective ratings depicted in .
Figure 6. Real-ear measurement for all 20 subjects to check acoustic transparency, as defined in the EUHA guidelines using the ISTS at 65 dB SPL. The plots show the level difference between free field and the remote microphone in a test box. As reference the free field is defined so that positive differences indicate a transmission of the WRMS with higher level.
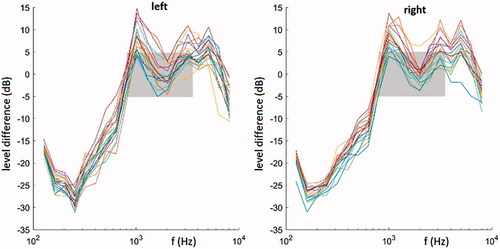
Figure 7. Speech intelligibility with and without WRMS for 20 normal-hearing listeners at noise levels of 60, 65, and 70 dB SPL.
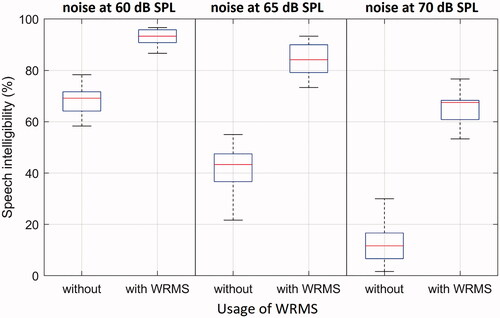
Table 9. Results of the post-hoc pairwise comparison with Bonferroni correction for the results of the speech test depicted in .
Table 10. Results of the post-hoc pairwise comparison with Bonferroni correction for the results of the speech test depicted in .