
Figures & data
Table 1. Details on the demographic of the study participants. All implants were manufactured by MED-EL (Innsbruck, AUSTRIA).
Table 2. Recording parameters and settings for standard ART and FineGrain approaches.
Figure 1. (A) Correlation analysis of ECAP thresholds determined with the FineGrain RT approach and standard ART. Pearson correlation coefficient (R) and the corresponding p value are shown. (B) Comparison of average ECAP thresholds determined with the FineGrain RT and standard ART. ECAP thresholds from all contacts were pooled. Grey diamond and number indicate the respective mean. The p value indicated on top is the result from a paired T test. qu = charge units (1 qu ≈ 1 nC).
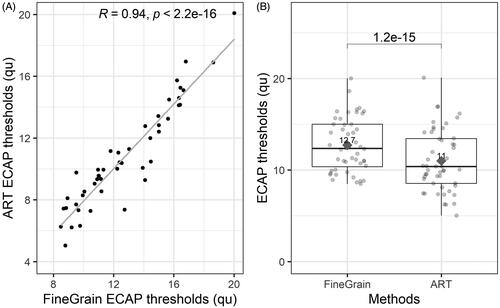
Figure 2. Results from the linear mixed model analysis on the effect of contact position onto ECAP thresholds. Point estimates of the ECAP threshold differences between contacts are shown with their respective confidence interval. Y-axis labels are the compared contacts with the second number being the reference point indicated as dotted line at 0. E.g. 6 – 2 refers to the differences between contacts 6 and 2, with contact 2 as reference point and indicates that contact 6 has lower ECAP thresholds than 2. This difference is significant as the confidence interval of the point estimate does not comprise the reference value. Exact values are shown in . qu = charge units (1 qu ≈ 1 nC).
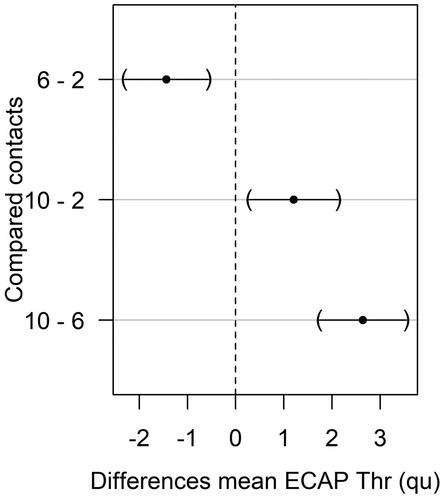
Figure 3. Correlation analysis of maximum comfort levels (MCLs) with ECAP thresholds determined with the FineGrain RT approach (at a stimulation rate of 60 Hz). Pearson corr. coefficient (R) and corresponding p value are indicated on top of each panel. qu = charge units (1 qu ≈ 1 nC).
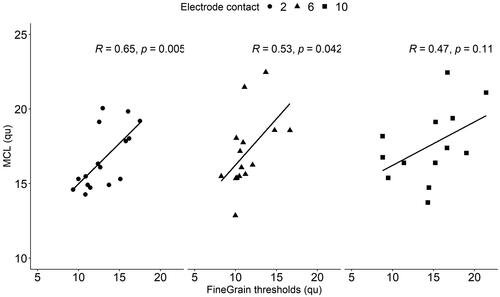
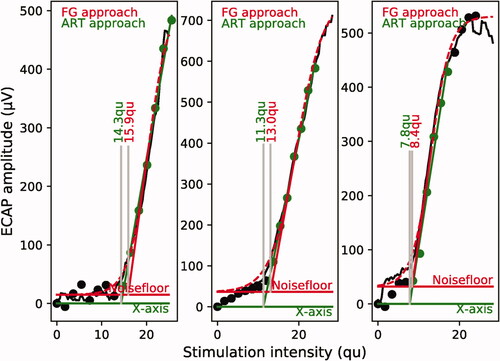
Figure 4. Three examples of ECAP amplitude growth functions recorded with ART and FineGrain. Stimulating contacts were 2, 6 and 10 from left to right. FG stands for FineGrain RT. Individual amplitudes are shown in black, as single dots for ART and single dots appearing as line for FineGrain. For ART, the amplitudes that were included for the linear fit by the expert are shown in green. Determined ECAP thresholds are indicated with the respective colour. qu = charge units (1 qu ≈ 1 nC).
Data availability statement
The data that support the findings of this study are available on request from the corresponding author, P.E.