
Figures & data
Table 1. cRCT outcome measures (ranges) and time points.
Figure 1. Flow of CP participants through the study.
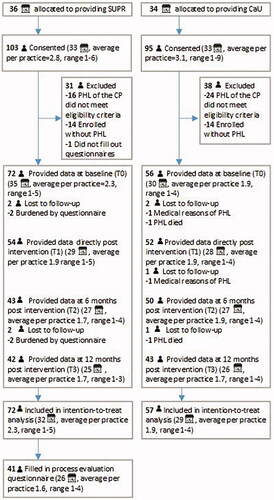
Table 2. Characteristics of CPs and their PHLs included in the ITT analysis (n = 128), and CPs included in the PE analysis (n = 41).
Table 3. Descriptive statistics and results of linear mixed models on third-party disability (mean or median SOS-HEAR domain- and total scores).
Table 4. Descriptive statistics and results of the linear mixed models on rehabilitation outcomes (IOI-HA-SO).
Figure 2. Mean post-intervention and CP and PHL scores on the IOI-HA-SO (CPs) and IOI-HA (PHLs) items “use”, “satisfaction”, and “quality of life”.
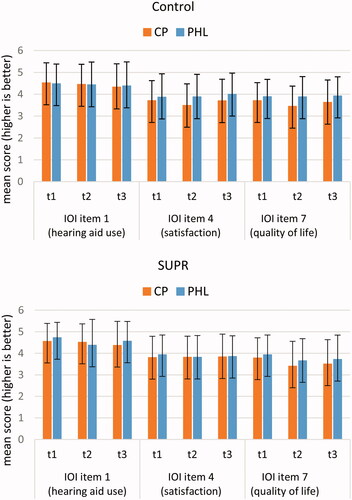
Table 5. Intervention dose-received: The extent to which CPs (n = 41) watched the educational videos.
Table 6. Satisfaction with SUPR: the extent to which CPs thought the particular SUPR element was useful for themselves and their PHL.