Figures & data
Table 1. Demographics in the cohort of patients provided with sequential bilateral CIs due to tinnitus annoyance (N = 20).
Figure 1. Flowchart demonstrating the study’s process.
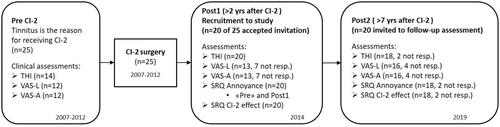
Table 2. Individual and group results for THI total, VAS Loudness, VAS Annoyance, SRQ Annoyance and SRQ CI-2 effect at Pre, Post1 and Post2 time-points (N = 20).
Figure 2. The Pre, Post1 and Post2 THI-scores for all 20 participants. The colours of the lines show the self-reported CI-2 effect (SRQ-score) on tinnitus from Post1 to Post2; the red line represents the participant who experienced increased tinnitus, the blue lines represent those who experienced no effect following CI-2 implantation and the green lines represent those who experienced a reduction in their tinnitus handicap after the CI-2 implantation. The number to the right of each line represents the patient identification, presented in .
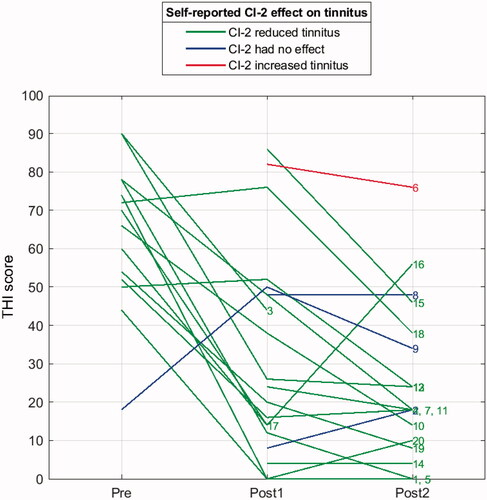
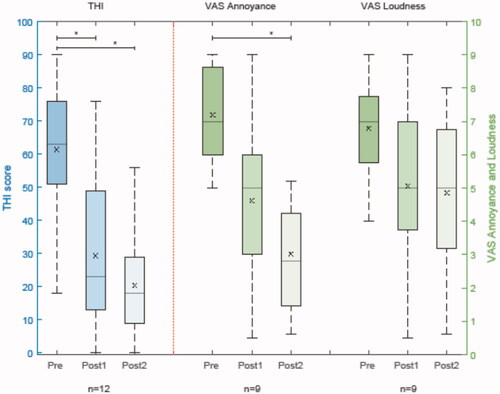
Figure 3. Box-and-whisker plots showing the THI-, VAS-A- and VAS-L-scores at the Pre, Post1 and Post2 time-points for the participants with complete THI (n = 12), VAS-A (n = 9), and VAS-L (n = 9) assessments throughout the study period. One asterisk (*) indicates a statistically significant difference, with p < 0.05. The means are marked with x in the same plots for each assessment (i.e., Pre, Post1 and Post2).