Figures & data
Table 1. Mean BC hearing thresholds for the test ear, with standard deviations (SD), measured for the study sample between 250 and 6000 Hz.
Table 2. Mean hearing thresholds in the sound field for subjects when using the high MPO device, the lower MPO device, or the unaided condition.
Figure 1. MPO (black lines) and aided speech spectra (grey lines) for the lower MPO device (solid lines) and the high MPO device (dashed lines) measured on skull simulator TU-1000 across the frequency range of 250–8000 Hz.
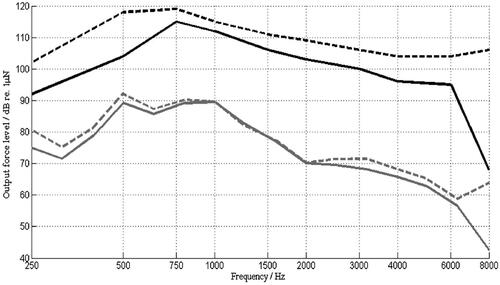
Figure 2. Mean word recognition scores were measured in quiet using the lower MPO device (light grey) and the high MPO device (dark grey). Error bars represent the standard error of the mean.
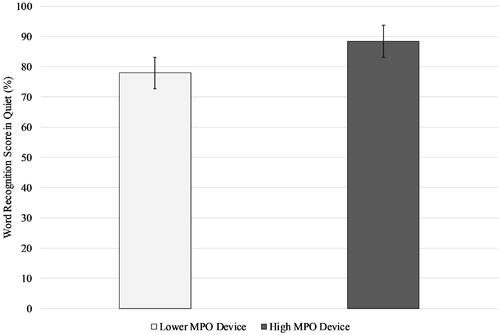
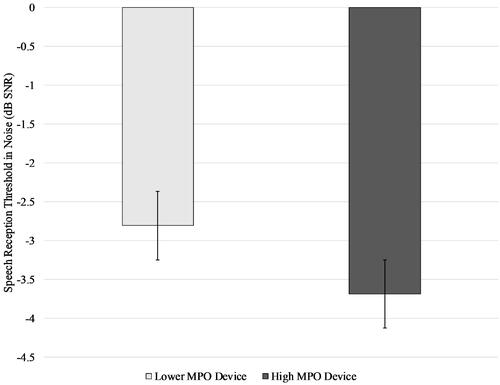
Figure 3. Mean speech reception thresholds were measured in noise using the lower MPO device (light grey) and the high MPO device (dark grey). Error bars represent the standard error of the mean.