
Figures & data
Table 1. Data sources used for estimating hearing aid coverage from EHIMA unit sales data.
Table 2. Unit sales of hearing instruments in millions per year and per region reported or estimated by EHIMA members.
Figure 1. Flowchart for calculation of Coverage.
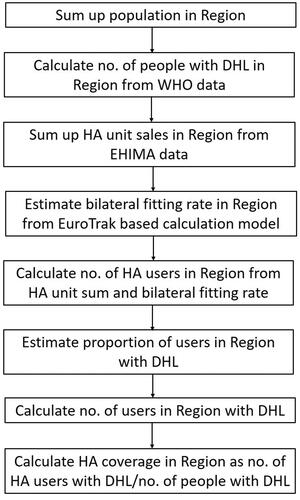
Figure 2. Bilateral fitting percentage from EuroTrak surveys plotted against gross national income (GNI) per capita in $. Also shown is a polynomial trendline and its equation.
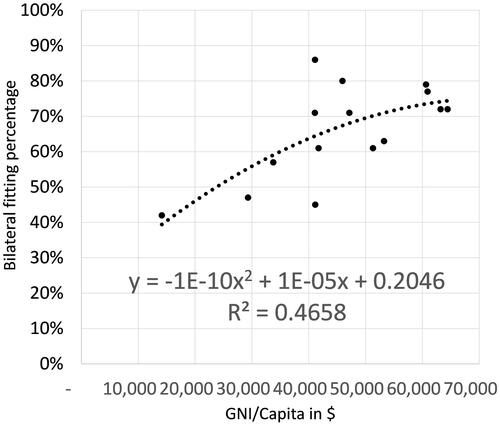
Table 3. Data and results on hearing instrument coverage for the WHO model with number of people with disabling hearing loss (DHL), important parameters and percentage of people with DHL using hearing instruments, 2018.
Figure 3. Coverage in the eight WHO regions. WHO: World Health Organization.
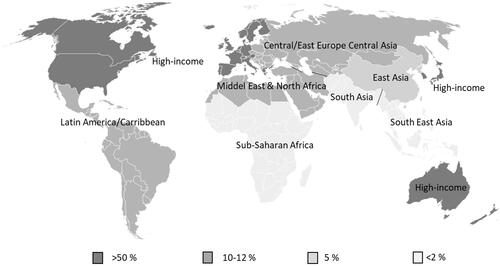
Figure 4. Coverage in the six GBD regions. GBD: global burden of disease.
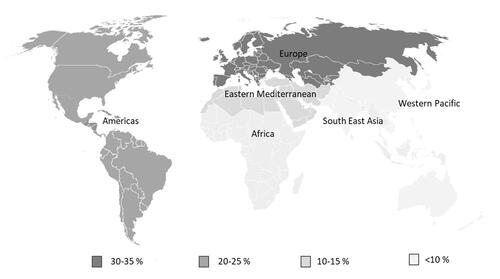
Table 4. Data and results on hearing instrument coverage for the GBD model with number of people with moderate to severe hearing loss (MSHL), important parameters and percentage of people using hearing instruments, 2018.
Table 5. Variations in Coverage for the low-income countries of the WHO model depending upon bilateral fitting %.