
Figures & data
Table 1. Summary of participant demographics.
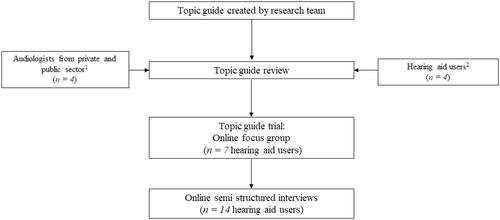
Figure 1. Flow chart detailing the progression from topic guide development to data collection. 1Audiologists suggested the inclusion of questions regarding the use of aided assessment methods, 2Hearing aid users recommended questions about accessibility and communication experiences within the audiology reception area/waiting area.
Supplemental material