Figures & data
Figure 1. Average participant audiogram (n = 19) for the left (black exes) and right ears (grey circles). Error bars represent one standard deviation of the mean. The maximum and minimum thresholds were shown in dotted and dashed lines respectively.
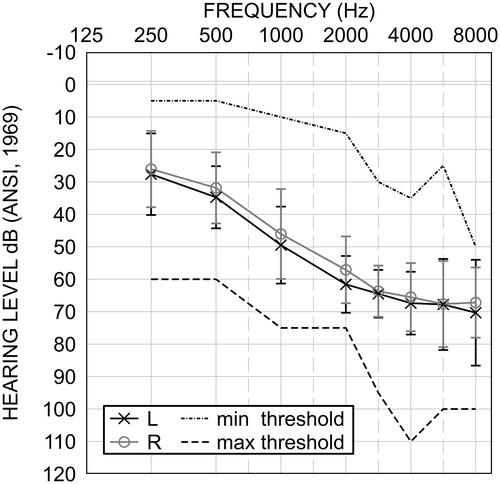
Table 1. Summary of participant demographics and hearing aid experience.
Figure 2. Electroacoustic signal-to-noise ratio (SNR) benefits of AF and non-AF-dirm conditions over the non-AF-omni condition (reference) across SNRs from −10 to +10 dB at speech levels of 62, 68, 75, and 85 dB SPL.
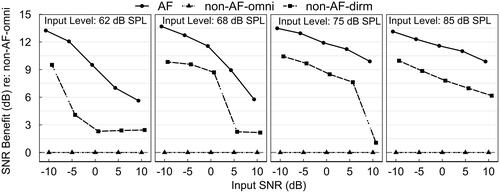
Figure 3. Tolerable Noise Level (TNL) tracings measured over the 2-min session as averaged across participants and tests/retests. Tracings are plotted for each HA condition (line types) at each speech input level (rows/panels).
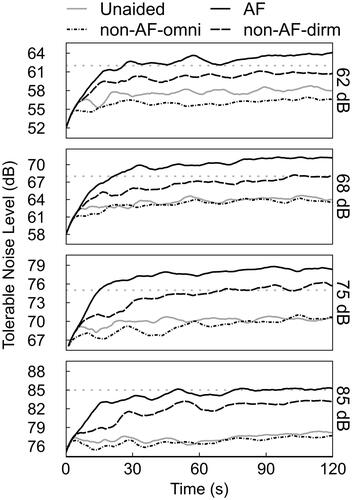
Figure 4. Average slopes (dB/s) of the TNL trace as calculated with linear least-squares fits of the first 30s of testing.
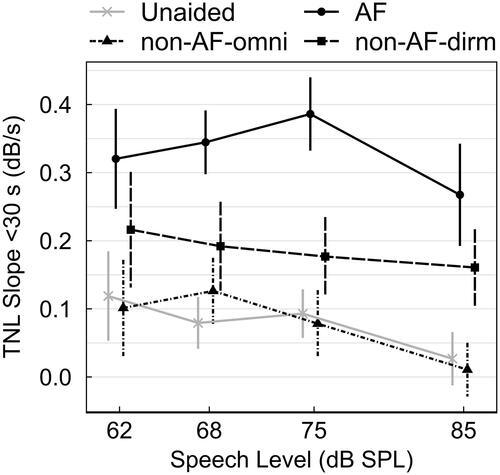
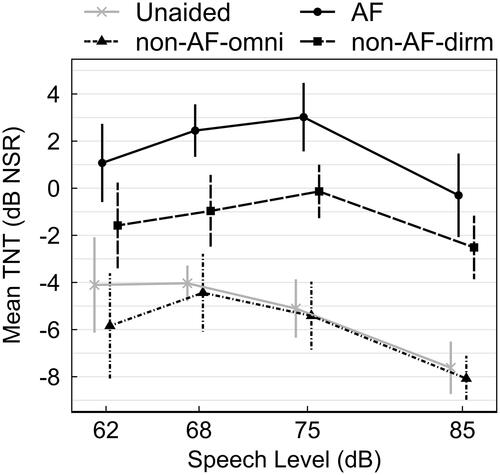
Figure 5. Mean TNTs expressed as NSR for each hearing aid condition. The TNTs were calculated as the difference between TNL (measured between 31 and 120s post onset) and the respective speech levels of each test condition.