Figures & data
Figure 1. Experimental setup. For acoustical stimulation, sound was provided to the external auditory canal by the loudspeaker ER-3A and sound pressure was measured with the probe microphone ER-7C. For electrical stimulation, the floating mass transducer (FMT) was either coupled to the short process (SP) or long process (LP) depicted with wide arrows. Laser Doppler vibrometry (LDV) measurements at the stapes (ST) or round window (RW) are depicted with dashed arrows. Small arrow: LP coupler arm.
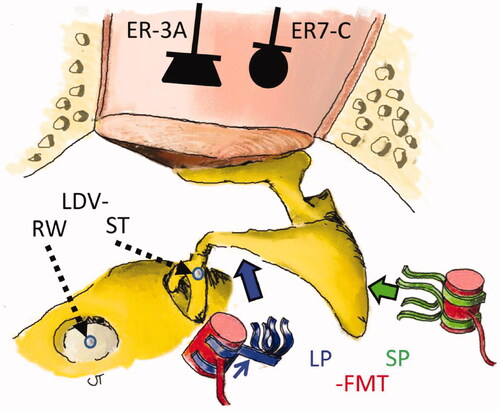
Figure 2. Effect of the FMT mass on the stapes (ST) and round window (RW) movement with acoustic stimulation for the short process (SP) and long process (LP) couplers. Coloured lines: single measurements. Dots: mean values; a significant difference (p > 0.05) is marked with filled dots.
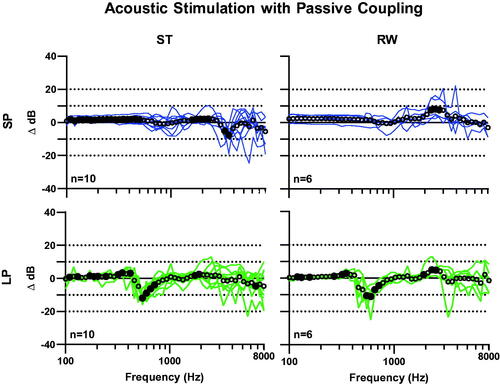
Figure 3. Mean transfer functions (upper plots) of electromechanical stimulation for SP- and LP-coupling and ratio between SP- and LP-coupling (lower plots) on the stapes (ST, left plots) and round window (RW, right plots). Error bars: confidence interval; Dots: means. Significant difference (p < 0.05) between SP and LP couplers are marked with filled dots.
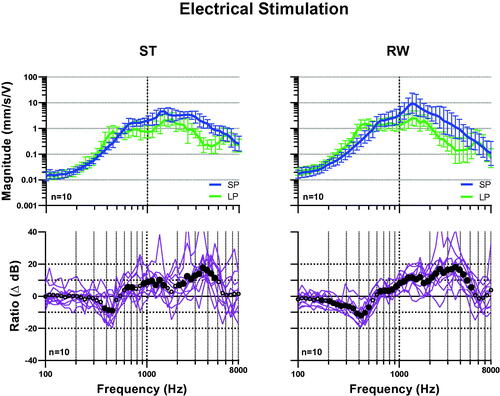
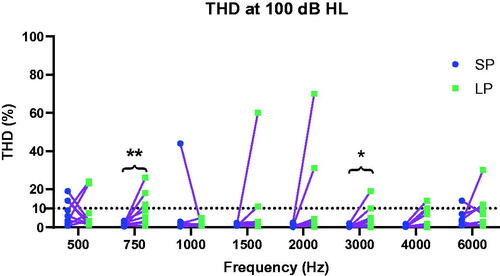
Figure 4. Total harmonic distortions (THD) of SP and LP coupling at eight frequencies at 100 dB HL eq. n = 10. Bullets: SP coupler, squares: LP coupler, lines: same ear. Paired Wilcoxon rank-sign test *: p < 0.05, **: p < 0.01.