
Figures & data
Table 1. Subject average hearing levels.
Figure 1. An example of the cross-correlation function between speech envelope and EEG from subject 1 for channel Fz. The x-axis indicates delay between envelope and EEG in ms. The y-axis indicates correlation value. The area between the dotted lines indicates the 5% bootstrap confidence interval. The maximum value corresponds to the XCOR index for this recording, and is clearly statistically significant.
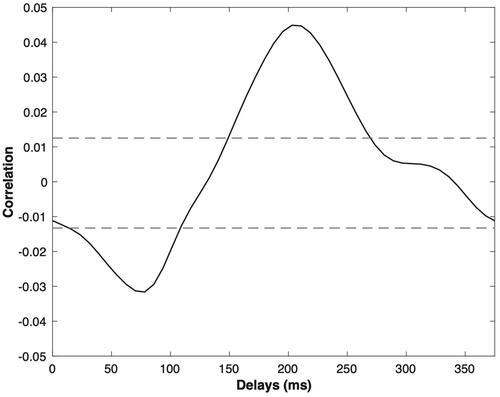
Figure 2. An example of the TRF-filter waveform from subject 1 for channel Fz. The x-axis indicates delay between envelope and EEG in ms. The y axis indicates the magnitude of the TRF impulse response.
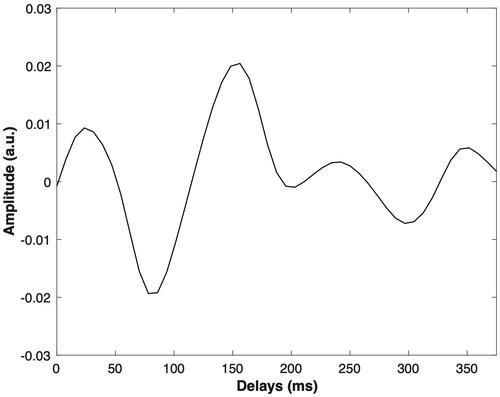
Figure 3. The number of subjects showing responses for each of the four parameters used in the analysis with progressively increasing amounts of data. (A) EEG data from the Fz channel. (B) EEG data from the Cz channel. Results are shown for forward speech and reverse speech (null hypothesis). For the latter, fewer than three detections were expected according to the 95% range of a binomial distribution of 17 measurements at p < 0.05.
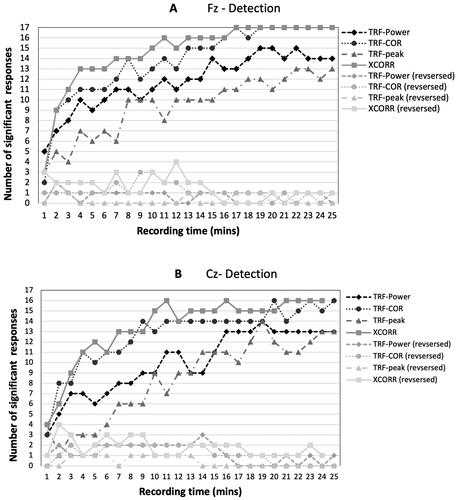
Figure 4. Mean detection times of the four parameters (TRF-peak, TRF-Power, TRF-COR, and XCOR) at Fz. Error bars represent standard error.
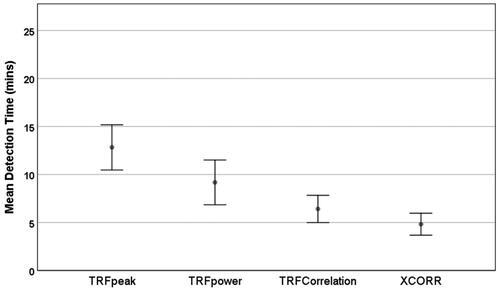
Figure 5. Detection times for individual subjects at Fz with each of the four detection parameters (TRF-Power, TRF-COR, TRF-Peak, and XCOR).
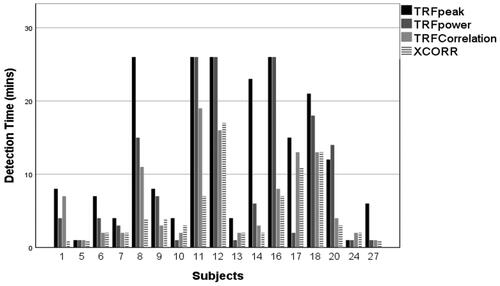
Figure 6. Detection rate of (A) XCOR and (B) TRF-COR parameters, analysed with three sets of EEG data: Fz only (dotted line), the best from 30-channels (dash-dotted line) and the best channel from six channels [Cz, Fz, F3, F4, FC1, and FC2] (dashed line).
![Figure 6. Detection rate of (A) XCOR and (B) TRF-COR parameters, analysed with three sets of EEG data: Fz only (dotted line), the best from 30-channels (dash-dotted line) and the best channel from six channels [Cz, Fz, F3, F4, FC1, and FC2] (dashed line).](/cms/asset/57c8bd27-2efe-4839-b75e-ee870dbd22e6/iija_a_2035832_f0006_b.jpg)
Table 2. Analysis of false positives (FP) rates for all analysis methods using white noise as input and output signals.