1,431
Views
1
CrossRef citations to date
0
Altmetric
Original Articles

The French MBAA2 sentence recognition in noise test for cochlear implant users

, , , , , , , & show all
Pages 304-311 | Received 25 Sep 2020, Accepted 14 Feb 2022, Published online: 15 Mar 2022

Figures & data

Figure 1. Examples of reduction of fixed-SNR testing data points to obtain the SNR50: The sigmoid (red curve) was fitted using an iterative, least-squares Levenburg-Marquart (L-M) method from all four points, three intermediate and the maximum, to give the SNR50 (short red line); three analytic sigmoid estimates of the SNR50 were calculated from two intermediate points and maximum (short black lines); the linear fit gives a large error in estimating the SNR50 when using intermediate data points 1 and 3 (e.g. short gold line).

Figure 1. Examples of reduction of fixed-SNR testing data points to obtain the SNR50: The sigmoid (red curve) was fitted using an iterative, least-squares Levenburg-Marquart (L-M) method from all four points, three intermediate and the maximum, to give the SNR50 (short red line); three analytic sigmoid estimates of the SNR50 were calculated from two intermediate points and maximum (short black lines); the linear fit gives a large error in estimating the SNR50 when using intermediate data points 1 and 3 (e.g. short gold line).

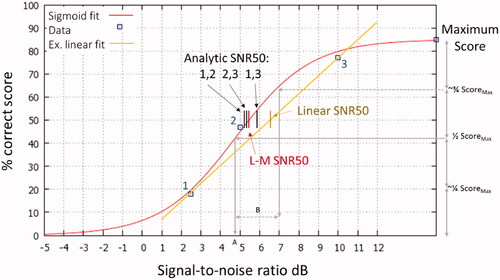
Table 1. Summary statistics for 15 CI listeners in Study 2 using the French matrix and MBAA2 sentence tests.

Table 2. Summary statistics for 15 CI listeners in Study 3 using MBAA2.

Figure 2. Scores for three lists exhibiting significant differences in mean scores (points) compared to all lists, and those nine having low item to total correlation (lines): Confidence intervals of scores for individual listeners are represented by the darker (68%) and lighter (95%) shading.

Figure 2. Scores for three lists exhibiting significant differences in mean scores (points) compared to all lists, and those nine having low item to total correlation (lines): Confidence intervals of scores for individual listeners are represented by the darker (68%) and lighter (95%) shading.

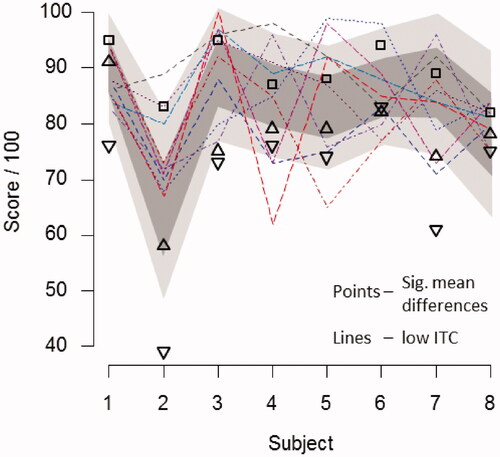
Table 3. Summary statistics for the full original set of 36 MBAA2 lists, and the reduced set of 24 lists.

Supplemental material

Supplemental Material

Download MS Excel (11.4 KB)

Supplemental Material

Download PDF (165 KB)

Supplemental Material

Download TIFF Image (60.1 KB)

Supplemental Material

Download TIFF Image (40.7 KB)