
Figures & data
Table 1. Demographic data.
Figure 1. Boxplots showing the distribution of individual fitting parameters at the apical, medial, and basal electrodes used for eliciting eACR. (a) Maximum comfortable loudness level (MCL) values in charge units (1 qu equals approximately 1 nC). (b) Phase duration (µs). (c) Rate of the biphasic pulses (pps) (the pulse rate at the medial and basal electrodes was lower than at the apical electrodes and is shown in a close-up box with a different y-axis). (d) Electrode impedance (kΩ). Horizontal lines represent the mean value of the 14 CI users, the crosses represent outliers. Statistics: ANOVA + Bonferroni multiple comparison test. *p < 0.05; **p < 0.01.
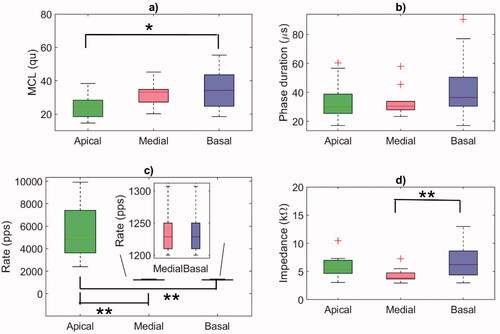
Figure 2. Top panel: (a) Grand-averages of eACR responses for 11 participants who had reproducible eACR, averaged across the three electrodes. Bottom panels: Individual (coloured curves) and total grand-average (black curves) eACR waveforms at different electrodes: (b) apical, (c) medial and (d) basal. Stimulation level was at 90% MCL.
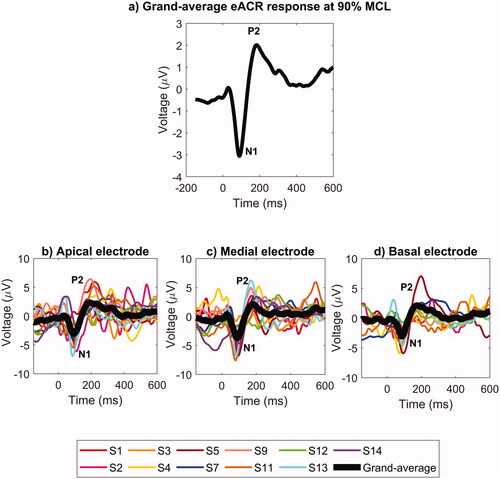
Figure 3. Boxplots showing the distribution of individual values for (a) the N1-P2 eACR amplitudes (µV), (b) the latency of the N1 peak (ms), and (c) the latency of the P2 peak (ms) measured at the apical, medial, and basal electrodes. The horizontal lines represent mean values, the crosses represent outliers. Statistics: two-sample t-tests. *p < 0.05.
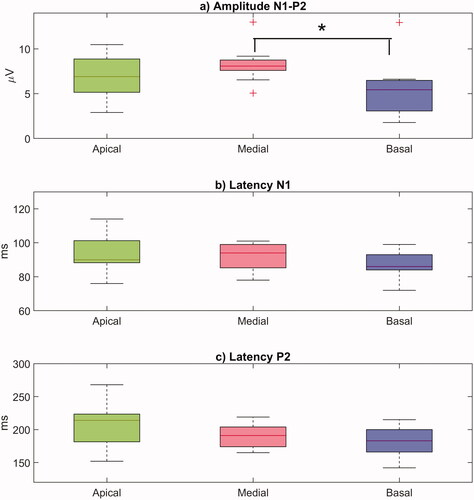
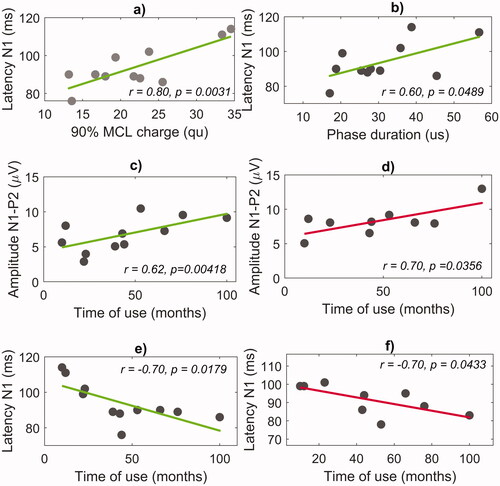
Figure 4. Correlation between the eACR parameters, the individual fitting parameters and time of CI use. The panels in the top row show the correlation of the N1 latency at the apical electrode with (a) the charge levels corresponding to 90% MCL and with (b) the phase duration. The panels in the second row show the correlation of the N1-P2 amplitudes with the time of CI use at (c) the apical and (d) the medial electrodes. The panels in the third row show the correlation of the N1 latency with the time of CI use at (e) the apical and (f) the medial electrodes.
Supplemental Material
Download MS Word (39.2 KB)Supplemental Material
Download MS Word (301.9 KB)Supplemental Material
Download MS Word (25.7 KB)Supplemental Material
Download MS Word (680.5 KB)Data availability statement
Data available on request from the authors.