Figures & data
Figure 1. Flow diagram of the selection process based on the Preferred Reporting Items for Systematic Reviews and Meta-Analyses (PRISMA). Note: n: number of studies; REM: real-ear measurement; HA: hearing aids.
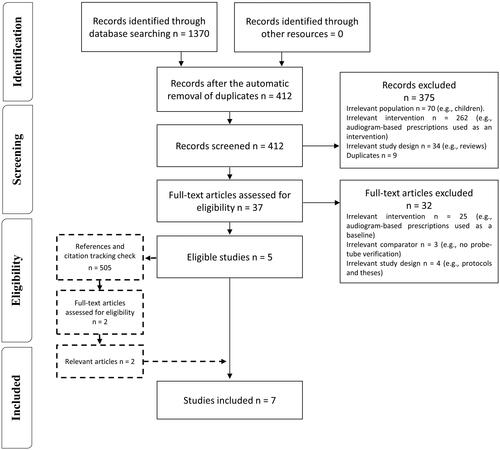
Table 1. Study characteristics.
Figure 2. Summary of intervention categories and studies involved.
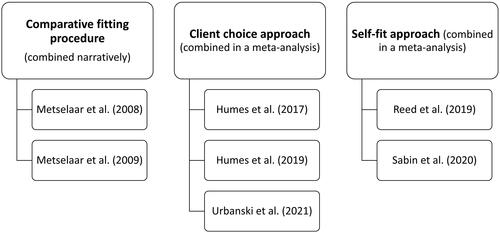
Figure 3. Forest plot of comparisons between client choice versus audiogram-based prescription, showing the SMD for each outcome. Squares represent the effect sizes or pooled effect estimates for each outcome, and whiskers denote the 95% confidence intervals around them. Note: n: number of studies; SMD: standardised mean difference; QoL: quality of life.
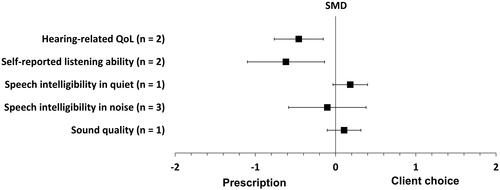
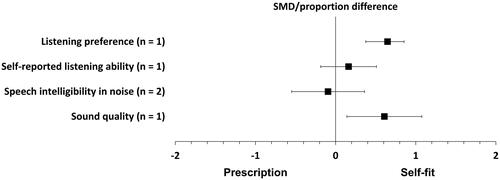
Figure 4. Forest plot of comparisons between the self-fit approach and audiogram-based prescription, showing the SMD or proportion difference for each outcome. Squares represent the effect sizes or pooled effect estimates for each outcome, and whiskers denote the 95% confidence intervals around them, except for listening preference, where the square represents the proportion difference and the whiskers denote the 95% confidence interval around it.