Figures & data
Figure 1. Example of cursored ABR waveform. Representative example of a 16 kHz ABR waveform that was cursored for amplitude and latency analysis. Cursors appear at positive P1, P2, and P3 peaks, and the negative troughs that followed.
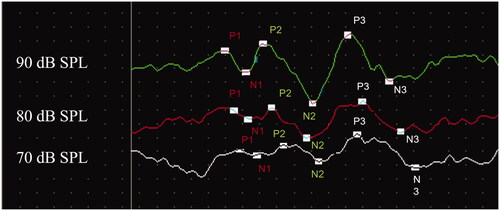
Figure 2. Breeder female ABR thresholds. Mean ABR thresholds from female breeder mice from Groups exposed to ARVs (ARV) and controls (CON). Error bars are ± 1 s.d. (A) Pre-exposure thresholds at the beginning of the experiment, prior to any breeding or dosing with ARV compounds. (B) Thresholds at the conclusion of the experiment. The ARV (black lines) and CON (red lines) groups were not significantly different from each other at any frequency or time point.
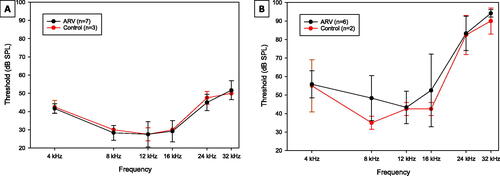
Figure 3. Wean-age ABR thresholds in the ARV and Control offspring. Wean age was three weeks for the offspring mice. Frequencies denoted with an asterisk are those at which the ARV group (black line) had significantly (p < 0.05) higher thresholds than the CON group (red line). Error bars are ± 1 s.d.
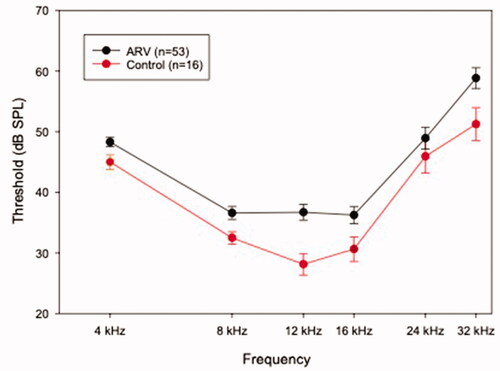
Figure 4. Supra-threshold ABR wave amplitudes and latencies in the ARV and Control offspring. Panels A and B display latency and amplitude, respectively, of the P1 wave. Panels C and D display latency and amplitude, respectively, of the P2 wave. Panels E and F display latency and amplitude, respectively, of the P3 wave. The ARV group (black bars) and the CON group (red bars) were not significantly different from each other at any stimulus level for any of the measures. Error bars are +1 s.d.
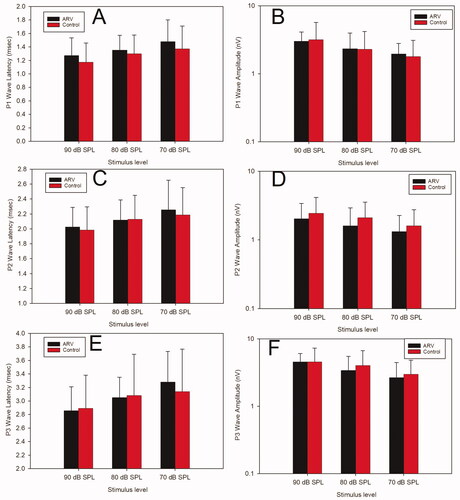
Figure 5. Representative image of a cochlea from a mouse in the ARV group. Samples are from the apical (A), middle (B), and basal (C) turns of the cochlea. Hair cells are stained with DAPI (blue fluorescence). Points of missing OHCs in Panels A and B are denoted with white arrows.
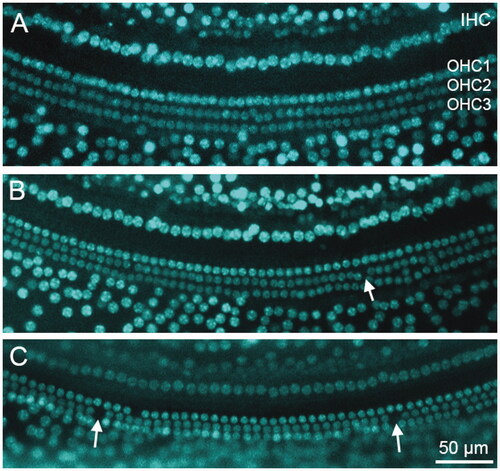
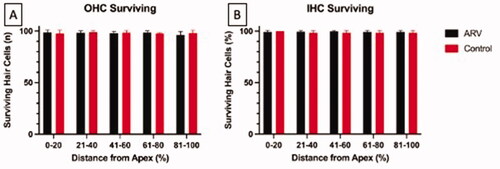
Figure 6. Panel A represents the number of intact OHCs surviving in each cochlear segment (denoted by their distance from the cochlear apex). Panel B indicates the percent of surviving IHCs for each cochlear segment. No significant differences exist across groups for any segment. For both panels, offspring from the ARV group are represented by black bars and the CON group by red bars. Error bars are + 1 s.d.