
Figures & data
Figure 1. Design of a source separation NMF algorithm.
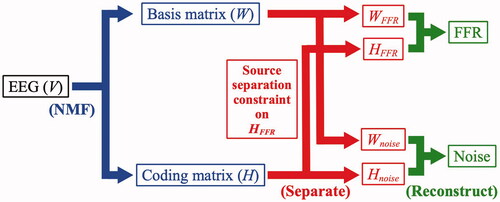
Figure 2. Procedural steps of an iteration cycle.
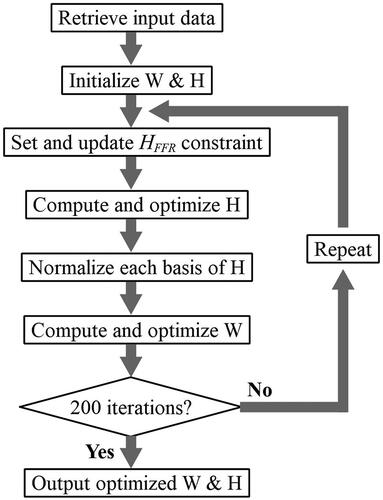
Figure 3. A typical example of the SSNMF decomposition. These grand-averaged spectrograms were obtained from fifteen adult participants when the 500 sweeps were included in the averaging procedure.
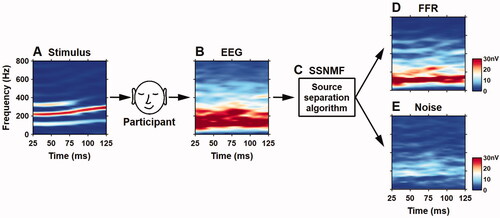
Figure 4. Application of the SSNMF algorithm on EEG recordings obtained in adult participants. Grand-averaged spectrograms of the input data (A), spectral-basis matrix (B), information-coding matrix (C), enhanced FFR (D), and extracted noise (E).
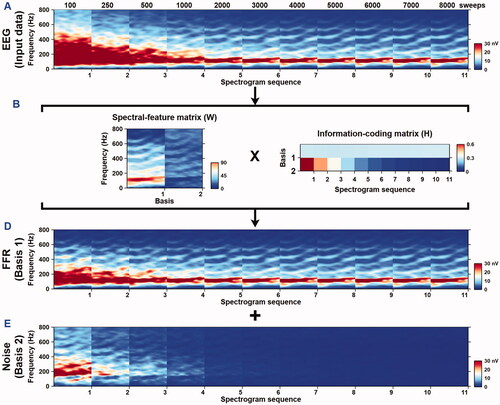
Figure 5. Application of the SSNMF algorithm on EEG recordings obtained in neonatal participants. Grand-averaged spectrograms of the input data (A), spectral-basis matrix (B), information-coding matrix (C), enhanced FFR (D), and extracted noise (E).
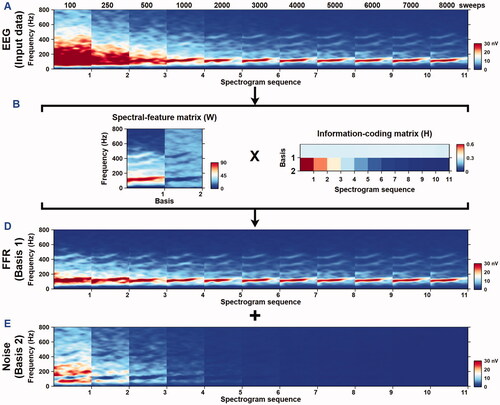
Figure 6. SSNMF performance in adult participants. A. Correlation coefficients before (i.e., the AVG condition) and after (i.e., the AVG + SSNMF condition) the SSNMF decomposition. B. FFR Enhancement as a function of the number of sweeps. C. RMSEs before (i.e., the AVG condition) and after (i.e., AVG + SSNMF condition) the SSNMF decomposition. D. Noise Reduction with increasing number of sweeps. Each shaded area represents the SSNMF performance in terms of FFR Enhancement and Noise Reduction. Δ Correlation = correlation coefficients obtained at the AVG + SSNMF condition – correlation coefficients obtained at the AVG condition. Δ RMSE = RMSE derived at the AVG + SSNMF condition – RMSE derived at the AVG condition. Each error bar indicates one standard error.
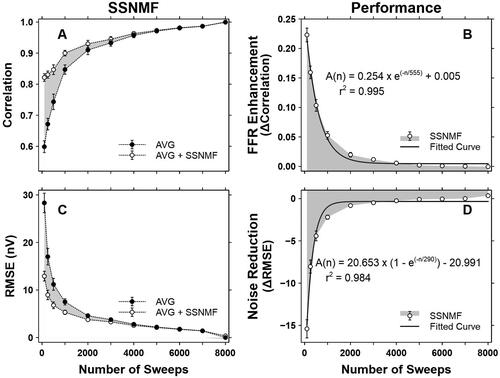
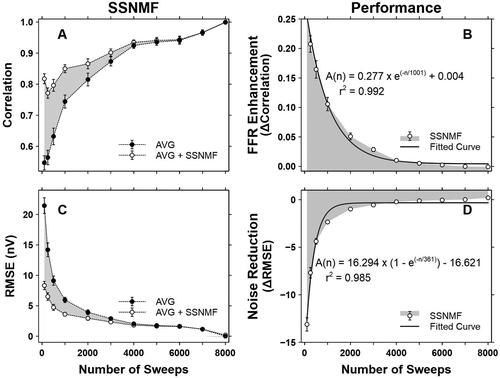
Figure 7. SSNMF performance in neonatal participants. A. Correlation coefficients before (i.e., the AVG condition) and after (i.e., the AVG + SSNMF condition) the SSNMF decomposition. B. FFR Enhancement as a function of the number of sweeps. C. RMSEs before (i.e., the AVG condition) and after (i.e., AVG + SSNMF condition) the SSNMF decomposition. D. Noise Reduction with increasing number of sweeps. Each shaded area represents the SSNMF performance in terms of FFR Enhancement and Noise Reduction. Δ Correlation = correlation coefficients obtained at the AVG + SSNMF condition – correlation coefficients obtained at the AVG condition. Δ RMSE = RMSE derived at the AVG + SSNMF condition – RMSE derived at the AVG condition. Each error bar represents one standard error.