
Figures & data
Table 1. Adaptive stimulus placement procedures investigated in this study. The prior and parameter and stimulus spaces are specified for each respective method.
Figure 1. Accuracy (absolute error in dB), bias (dB) and reliability (ICC) of each analysis-procedure combination for a target of SRT50. Error bars indicate 95% confidence interval of the means.
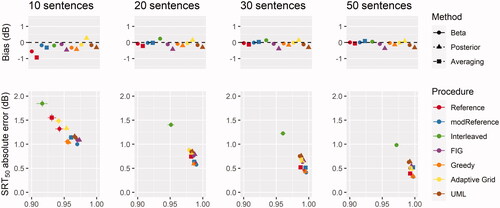
Figure 2. Accuracy (absolute error in dB), bias (dB) and reliability (ICC) of each analysis-procedure combination for a target of SRT75. Error bars indicate 95% confidence interval of the means.
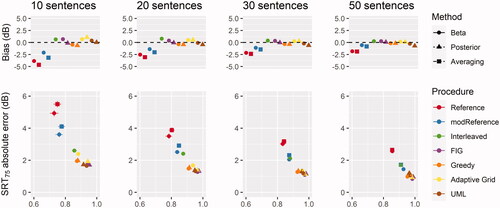
Figure 3. Histograms of stimulus placements corresponding to individual listener’s intelligibilities with target intelligibilities of 50% (top row) and 75% (bottom row) respectively.
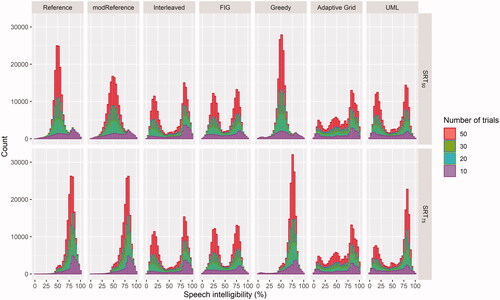
Figure 4. Accuracy (absolute error) and reliability (ICC) of each analysis-procedure combination for PF width estimation. Error bars indicate 95% confidence interval of the means.
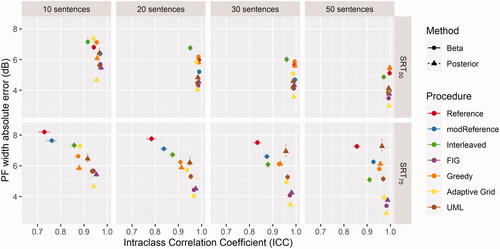
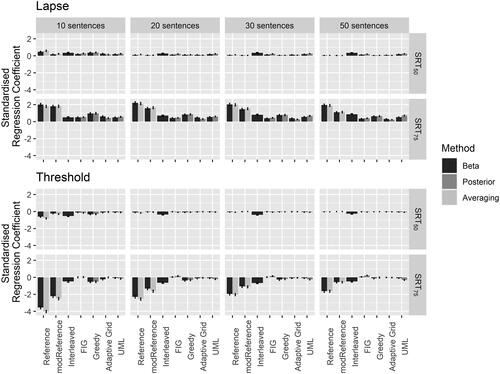
Figure 5. Standardised regression coefficients for lapsing rate and threshold, target intelligibility, method and procedures. The ordinate indicates the predicted change in absolute error in dB for a one standardised unit change in the respective predictor. Error bars indicate the 95% confidence interval of the regression coefficient.